Monitoring with Prometheus and Grafana
This section describes how to set up of monitoring and tracking various metrics and parameters of the operation of nodes (servers) on which Platform is installed, using Prometheus and Grafana.
Initial Actions
To prepare for setting up the monitoring process, install the latest versions of docker and docker-compose. You need to install standalone executables docker and docker-compose, not integrate them as plugins into the existing docker installation:
# install the required components and connect the keys for the repository
apt-get update
apt-get install ca-certificates curl gnupg
install -m 0755 -d /etc/apt/keyrings
curl -fsSL https://download.docker.com/linux/ubuntu/gpg | gpg --dearmor -o /etc/apt/keyrings/docker.gpg
chmod a+r /etc/apt/keyrings/docker.gpg

# add the repository for docker
sudo vim /etc/apt/sources.list.d/docker.list

# add the repository
deb [arch=amd64 signed-by=/etc/apt/keyrings/docker.gpg] https://download.docker.com/linux/debian buster stable

# update the cache and install docker and all components
apt update
apt-get install docker-ce docker-ce-cli containerd.io docker-buildx-plugin

# install docker-compose as a separate executable file; at the time of writing these instructions, the current version is 2.23.0
curl -SL https://github.com/docker/compose/releases/download/v2.23.0/docker-compose-linux-x86_64 -o /usr/local/bin/docker-compose
chmod +x /usr/local/bin/docker-compose
ln -s /usr/local/bin/docker-compose /usr/bin/docker-compose
Starting Components
Next, start the required components:
Create a docker-compose.yml file containing the following services:
version: '3.9'

services:

prometheus:
    image: prom/prometheus:latest
    volumes:
    - ./prometheus/configuration/:/etc/prometheus/
    - ./prometheus/data/:/prometheus/
    container_name: prometheus
    hostname: prometheus
    command:
    - '--config.file=/etc/prometheus/prometheus.yml'
    - '--web.enable-admin-api'
    - '--web.enable-lifecycle'
    ports:
    - 9090:9090
    restart: unless-stopped
    environment:
    TZ: "Europe/London"
    networks:
    - default

node-exporter:
    image: prom/node-exporter
    volumes:
    - /proc:/host/proc:ro
    - /sys:/host/sys:ro
    - /:/rootfs:ro
    container_name: exporter
    hostname: exporter
    command:
    - --path.procfs=/host/proc
    - --path.sysfs=/host/sys
    - --collector.filesystem.ignored-mount-points
    - ^/(sys|proc|dev|host|etc|rootfs/var/lib/docker/containers|rootfs/var/lib/docker/overlay2|rootfs/run/docker/netns|rootfs/var/lib/docker/aufs)($$|/)
    ports:
    - 9100:9100
    restart: unless-stopped
    environment:
    TZ: "Europe/London"
    networks:
    - default

grafana:
    image: grafana/grafana
    user: root
    depends_on:
    - prometheus
    ports:
    - 3000:3000
    volumes:
    - ./grafana:/var/lib/grafana
    - ./grafana/provisioning/:/etc/grafana/provisioning/
    container_name: grafana
    hostname: grafana
    restart: unless-stopped
    environment:
    TZ: "Europe/London"
    networks:
    - default

networks:
default:
    ipam:
    driver: default
    config:
        - subnet: 172.28.0.0/16
This file contains:
prometheus service,
prometheus-node-exporter service,
grafana service,
default network (172.28.0.0/16).
All containers are started with IP addresses specified in the default range. This range is specified after the subnet parameter, which can be found in the very last line of the above docker-compose.yml file. In this case, range 172.28.0.0/16 means that the started containers will have IP addresses starting from 172.28.0.0 and ending at 172.28.255.255.
In the directory containing docker-compose.yml, create file structure and basic configuration files for Prometheus:
mkdir -p prometheus/configuration/ mkdir -p prometheus/data/

# grant write permissions to the prometheus data folder
chown 65534:65534 prometheus/data/

# create a configuration file for collecting metrics from the prometheus-node-exporter service

cat << EOF >> prometheus/configuration/prometheus.yml scrape_configs: - job_name: node scrape_interval: 5s static_configs: - targets: \['node-exporter:9100'] EOF
Run docker-compose from the directory containing docker-compose.yml file:
docker-compose up -dIf you are running docker-compose from another directory, specify the path to file docker-compose.yml file using -f flag :
docker-compose -f <path_to_docker-compose.yml_file> up -dIf docker-compose is running, three containers will appear:
prometheus,
exporter,
grafana.
You can check them using the following command:
docker container ps -aAs a result, you see information on all running containers in docker:
CONTAINER ID IMAGE COMMAND CREATED STATE PORTS NAMES 2cae7b16d140 prom/prometheus:latest "/bin/prometheus --c…" 1 minute ago 1 minute ago 0.0.0.0:9090->9090/tcp prometheus b67cb56199ff grafana/grafana "/run.sh" 1 minute ago 1 minute ago 0.0.0.0:3000->3000/tcp grafana 01eb08aa5db9 prom/node-exporter "/bin/node_exporter …" 1 minute ago 1 minute ago 0.0.0.0:9100->9100/tcp exporterHere you can see:
CONTAINER ID — container identifier;
IMAGE — used image;
COMMAND — command to run the container;
CREATED — time when container was created;
STATE — container state;
PORTS — used ports.
docker-compose.yml contains two services with a full chartical interface: Grafana and Prometheus. They are available at the following addresses:
Prometheus Configuration
After starting the components, two directories will be created in the directory from which the docker-compose.yml was launched:
grafana — stores created dashboards and metrics;
prometheus — stores two directories:
configuration — stores the configuration file prometheus.yml;
data — stores the data of prometheus itself.
To configure Prometheus, follow these steps:
Edit prometheus/configuration/prometheus.yml to add metrics for monitoring node state to be collected by Prometheus:
    scrape_configs:
- job_name: node scrape_interval: 5s static_configs:
    - targets: \['node-exporter:9100']

# to add a new job for metric collection, create a new item
- job_name: some_name_here scrape_interval: 5s static_configs:
    - targets:
        - target1:9100
        - targetN:9100 # within a single job, metrics can be collected from different nodes. Sometimes this is useful for building dashboards;
prometheus.yml contains many other settings. Information on them can be found in the official documentation.
Send a request to the container to reread the file (to account for new changes). To do this, run the following command from the directory containing**docker-compose.yml**, which was used to start the prometheus service:
docker-compose kill -s SIGHUP prometheus
Deleting Prometheus metrics
During operation, there may be cases when it is necessary to clear some data in Prometheus. For example, when collecting metrics, the same information is collected differently, leading to collisions or incorrect information display in dashboards. The command examples presented below are based on running Prometheus through the docker-compose.yml with all settings, especially port and launch flag settings.
When starting Prometheus by another method, add the administrator’s ability to work with the API and check the service launch port. In this example, it is port 9090.
To delete all metrics under a specific label (for example, foo=bar), run the following command:
curl -X POST \
  -g 'http://localhost:9090/api/v1/admin/tsdb/delete_series?match\[]={foo="bar"}'
To delete metrics by job or by instance, the following commands are used:
curl -X POST -g 'http://localhost:9090/api/v1/admin/tsdb/delete_series?match\[]={job="node_exporter"}'

curl -X POST -g 'http://localhost:9090/api/v1/admin/tsdb/delete_series?match\[]={instance="192.168.0.1:9100"}'
After deleting data from Prometheus, Grafana dashboards will be filled according to the scrape_interval parameter specified in each Prometheus job. These jobs can be found in prometheus.yml file placed in the prometheus/configuration/ directory.
Configuring Grafana
Grafana can be configured in the following ways:
through the chartical interface, adding or changing dashboards;
by editing files in the Grafana directory created in the directory containing the docker-compose.yml file used to launch the configured container.
The results of the commands below may differ from those shown in the example screenshots and display an approximate view of the metrics. Detailed settings (format of displayed metrics, update frequency, and other parameters) are made by users individually depending on their needs.
When accessing the port http://<installation_node_IP>:3000, the Grafana authorization menu will open:

For the first login, use the following credentials:
login: admin
password: admin
Upon the first successful login, the system will prompt you to change them.
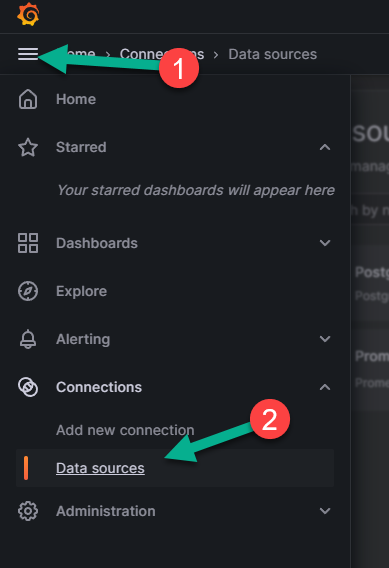
To add a data source (in this case, Prometheus), follow these steps:
Open the menu panel located in the upper left corner of the page (number 1 in the image below).
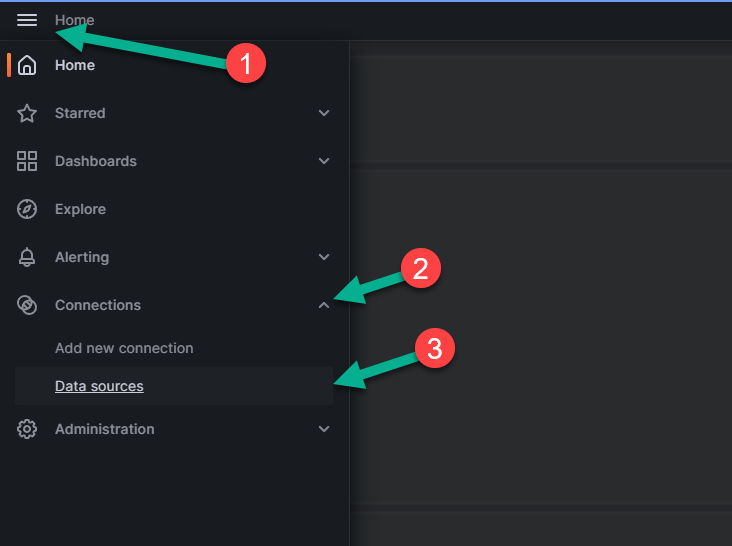
Expand the “Connections” section by clicking the arrow next to it (number 2 in the figure above).
Click ‘Data sources’ option, number 3 in the figure above. The following page will open:
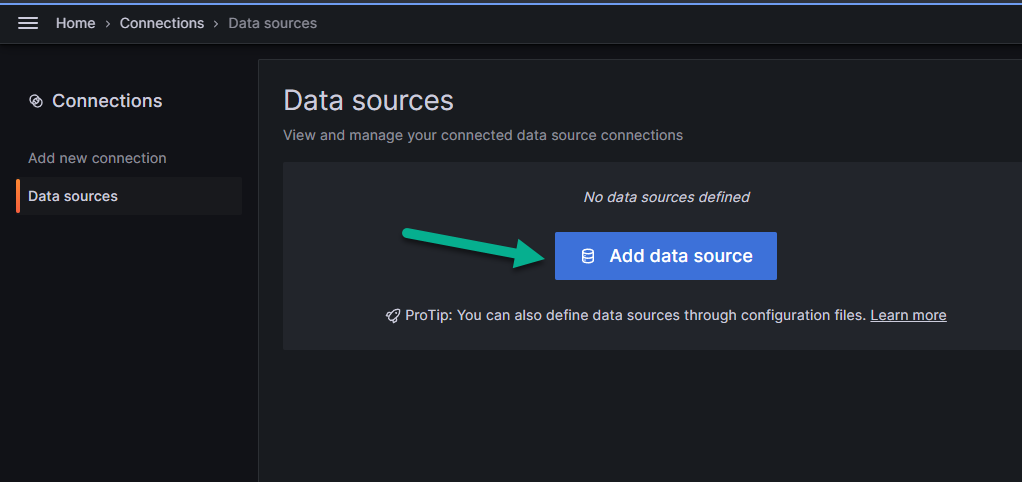
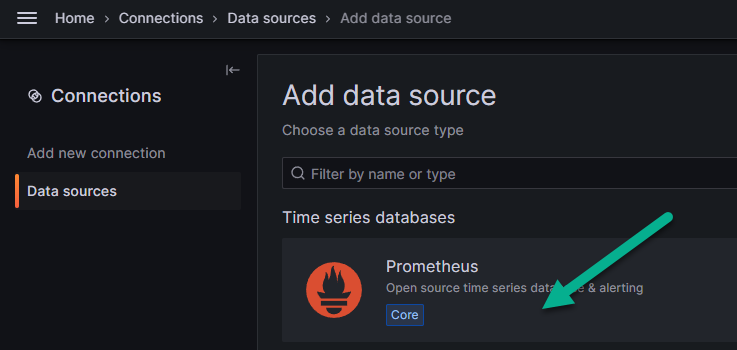
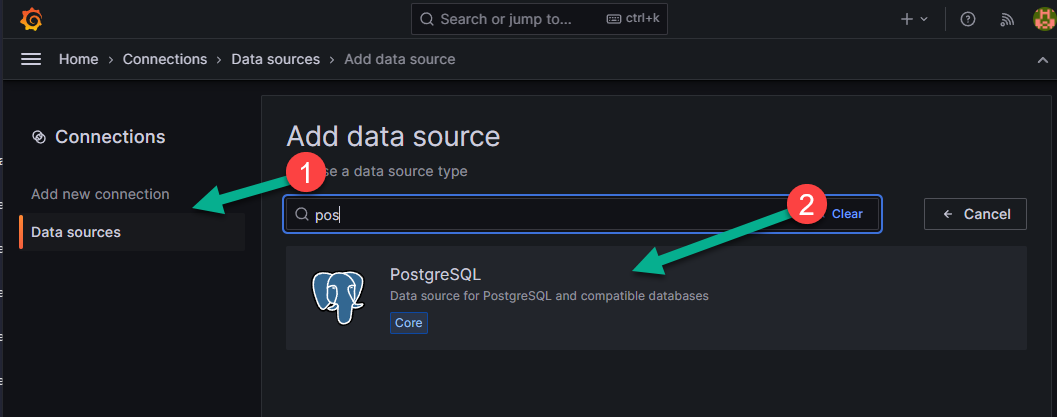
Click “Add data source” shown in the figure above.
In the menu that appears, find Prometheus and select it.
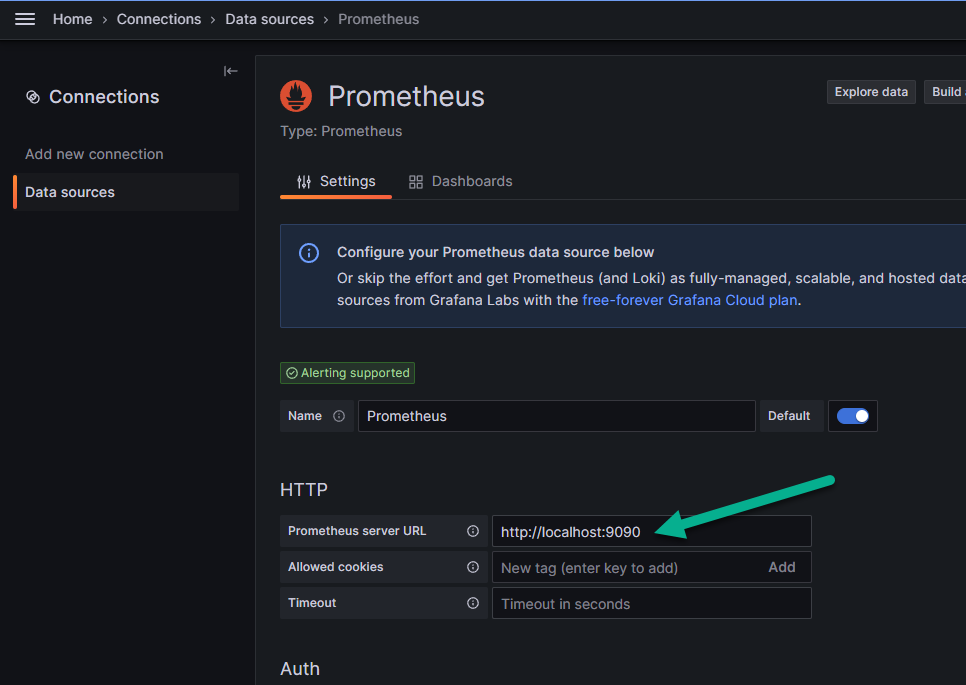
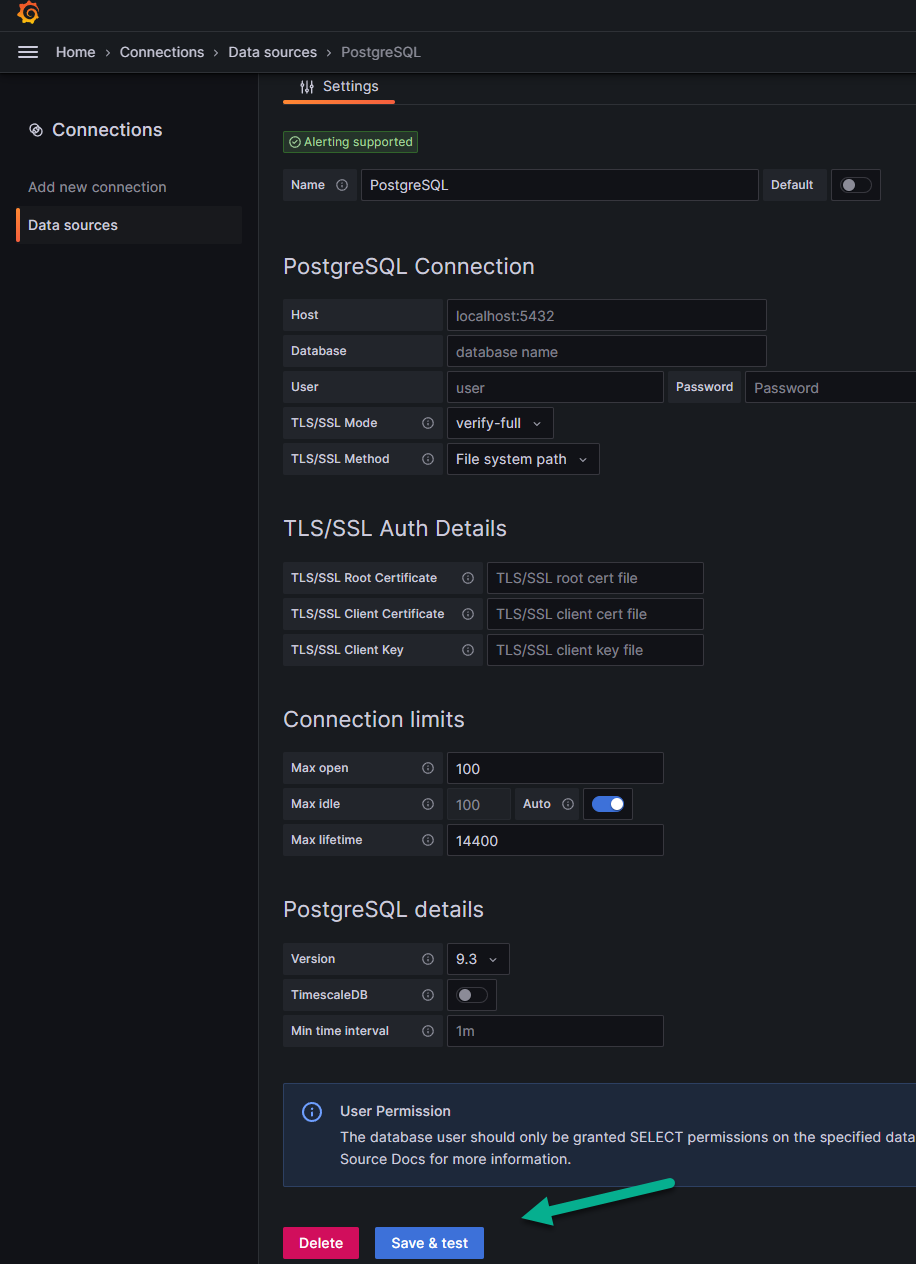
On the “Settings” tab, in the text field “Prometheus server URL”, indicated by the arrow in the image below, enter the IP address of the node where Prometheus is deployed. The final value should look like: http://<installation_node_IP>:9090
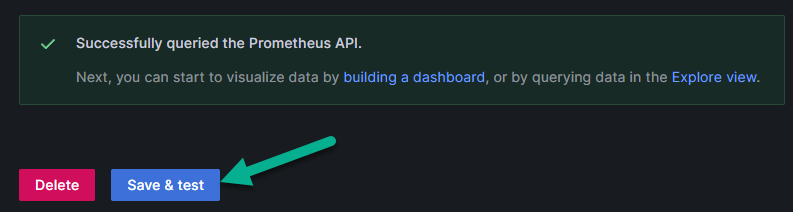
Click “Save & test”. After that, the connection will be tested. In case of a successful connection to the Prometheus data source, a notification will appear, as shown in the image below.
After adding the data source, you need to configure the dashboards to display information. To add a dashboard, follow these steps:
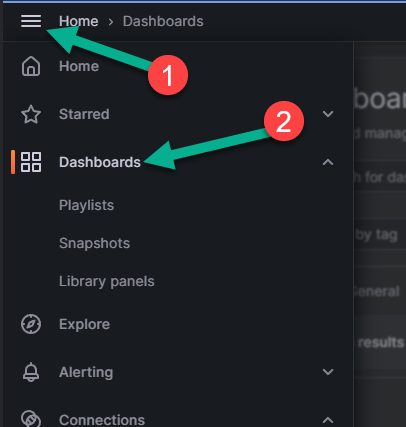
Open the menu panel located in the upper left corner of the page (number 1 in the image below).
Select the “Dashboards” menu item, number 2 in the image below.
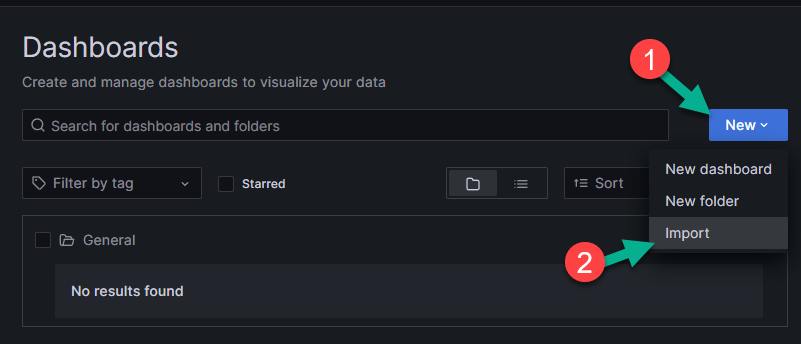
page that appears, click “New” (number 1 in the picture below).
In the menu, select the “Import” item (number 2 in the picture below).
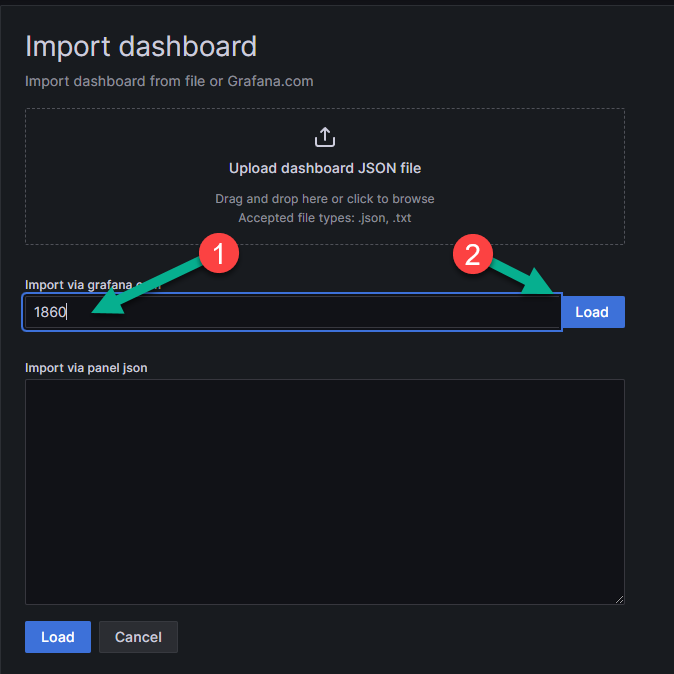
In the text field (number 1 in the picture below), enter the dashboard you want to import. In this example, 1860 is the collected dashboard for Node Exporter. Examples of ready-made dashboards can be found on the official website <https://grafana.com/grafana/dashboards/>.
Click “Load” to load the dashboard (number 2 in the picture below). You can also import the dashboard by pasting the JSON code into the lower text field. After loading the dashboard in a convenient way, click “Load” again at the bottom of the window.
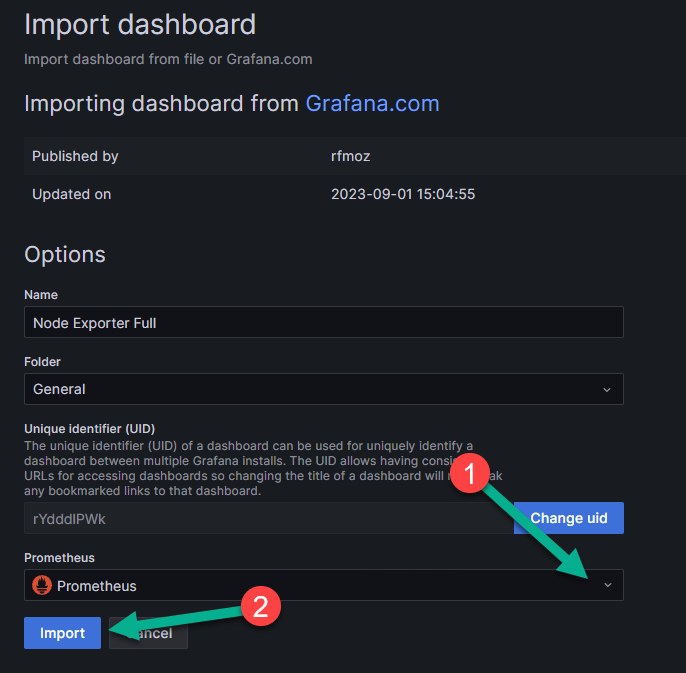
On the final import page that appears, in the “Folder” field, select the folder where the imported dashboard will be displayed. By default, this is the “General” folder, created automatically.
In the dropdown list (number 1 in the picture below), specify Prometheus.
Click “Import” for the final import of the dashboard (number 2 in the picture below).
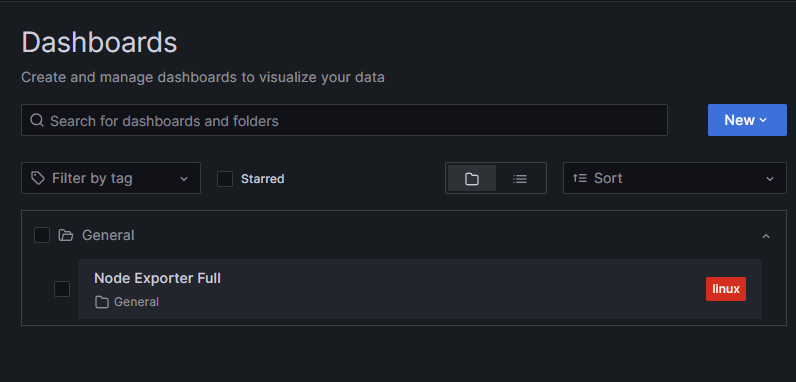
On the Dashboards page, after adding, the dashboard will be displayed in the folder selected on the final import page. In this example, it is the “General” folder.
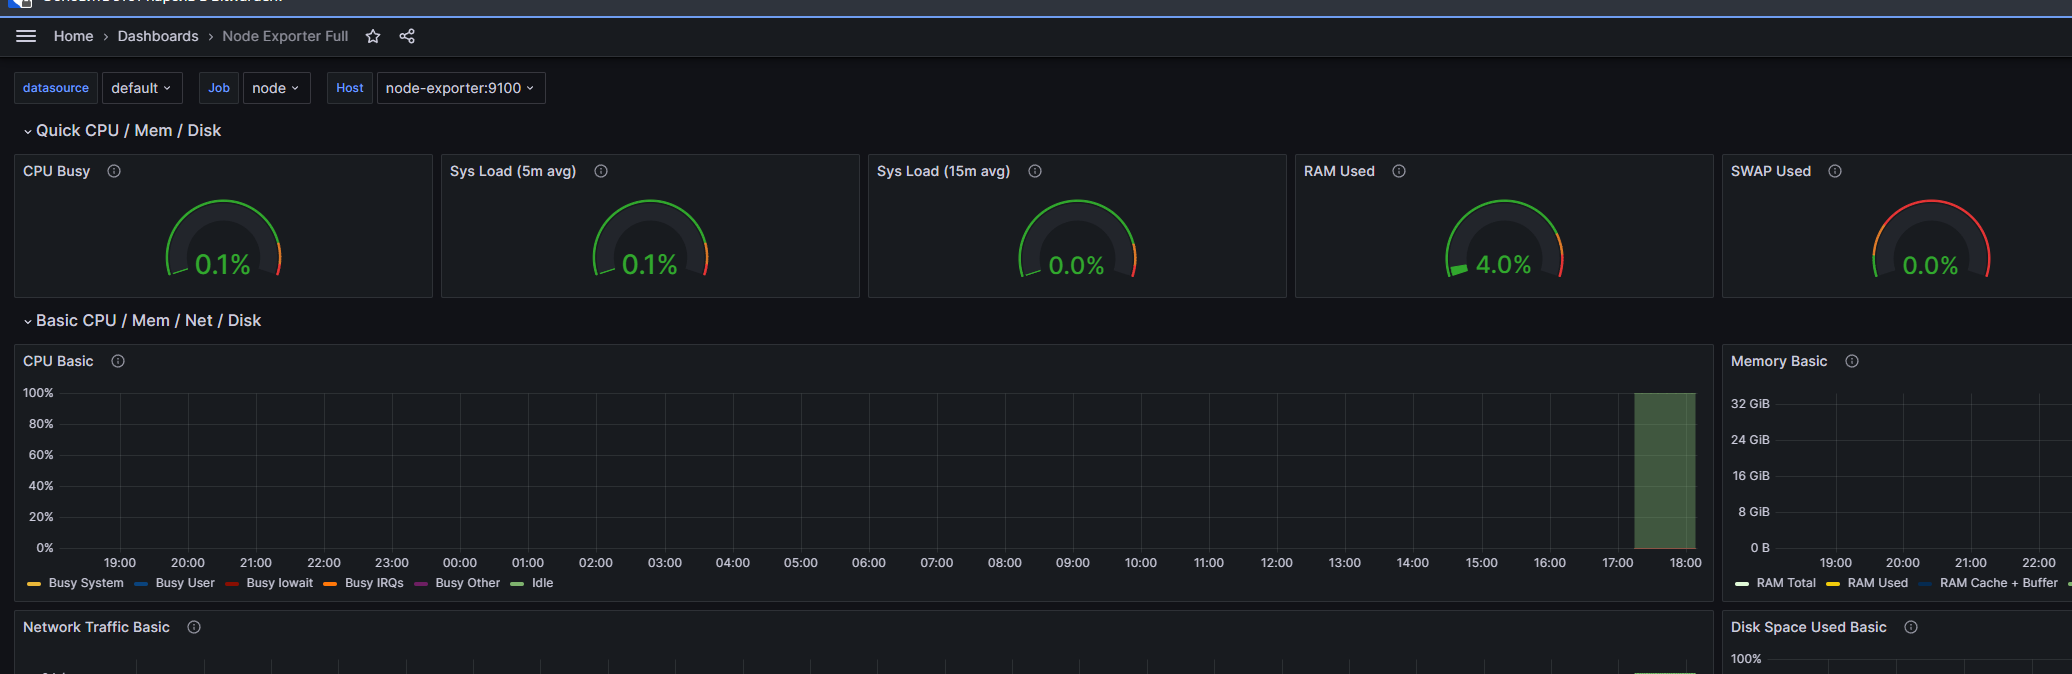
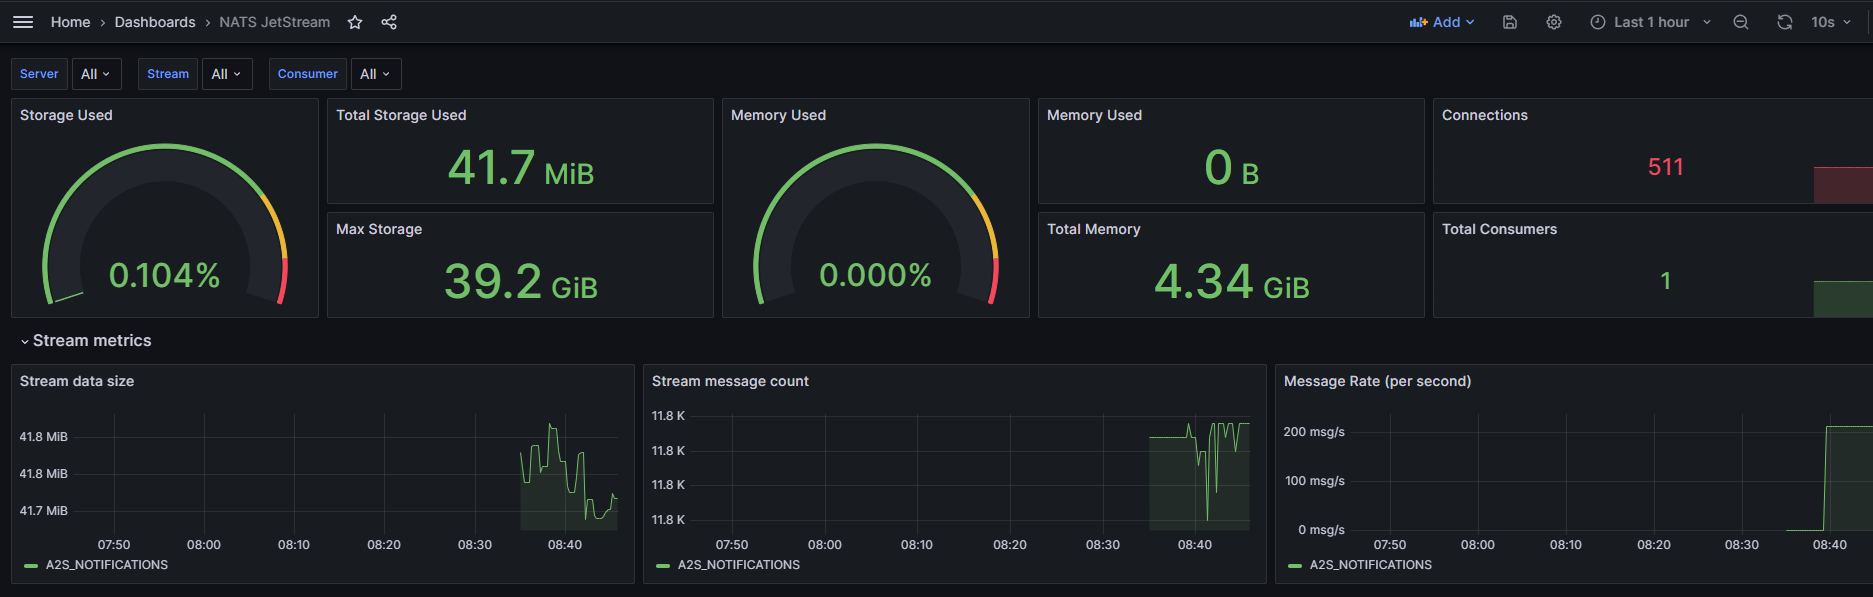
When navigating to the imported dashboard, a page with data about it will open:
Monitoring NATS
On all nodes where the NATS server is installed, it opens port 8222, which exposes a number of metrics. These metrics can be processed using the corresponding exporter.
To connect NATS to monitoring using Prometheus, follow these steps:
start the NATS exporter. You can use the official documentation to run the exporter as a service or start it using docker-compose, using the example above:
version: '3.9'

services:

prometheus-nats-exporter:
  image: natsio/prometheus-nats-exporter:latest
    container_name: prometheus-nats-exporter
    hostname: prometheus-nats-exporter
    command: "-connz -gatewayz -healthz -jsz all -subz -leafz -routez -varz http://<host_IP_with_installed_nats_server>:8222"
    ports:
    7777:7777
    restart: unless-stopped
    environment:
    TZ: "Europe/London"
    networks:
    - default

networks:
default:
    ipam:
    driver: default
    config:
        - subnet: 172.28.0.0/16
NATS has various metrics that can be collected by nats-exporter. Go to http://<host_IP_with_installed_nats_server>:8222 and, by following the links, find the necessary set of metrics to monitor. After that, find the necessary flags for these metrics in the official documentation.
For example, the NATS server provides the JetStream state at http://<host_IP_with_installed_nats_server>:8222/jsz/metrics. To start processing metrics with the exporter, you need to add -jsz all as a flag in the command directive, as shown in the example of the docker-compose.yml file above.
start the service using docker-compose from the directory with the created docker-compose.yml file:
docker-compose up -d
check that nats-exporter provides metrics for the prometheus server on the port specified in the ports directive (in the example above, this is port 7777):
curl http://<host_IP_with_installed_nats_server>:7777/metricsThe response will contain metrics describing the server’s state:
...
# HELP jetstream_server_jetstream_disabled JetStream disabled or not
# TYPE jetstream_server_jetstream_disabled gauge
jetstream_server_jetstream_disabled{cluster="awide",domain="",is_meta_leader="false",meta_leader="devops-nats-3.awide.tech",server_id="http://10.128.0.69:8222",server_name="devops-nats-1.awide.tech"} 0
# HELP jetstream_server_max_memory JetStream Max Memory
# TYPE jetstream_server_max_memory gauge
jetstream_server_max_memory{cluster="awide",domain="",is_meta_leader="false",meta_leader="devops-nats-3.awide.tech",server_id="http://10.128.0.69:8222",server_name="devops-nats-1.awide.tech"} 1.554736128e+09
# HELP jetstream_server_max_storage JetStream Max Storage
# TYPE jetstream_server_max_storage gauge
jetstream_server_max_storage{cluster="awide",domain="",is_meta_leader="false",meta_leader="devops-nats-3.awide.tech",server_id="http://10.128.0.69:8222",server_name="devops-nats-1.awide.tech"} 1.402610688e+10
# HELP jetstream_server_total_consumers Total number of consumers in JetStream
# TYPE jetstream_server_total_consumers gauge
jetstream_server_total_consumers{cluster="awide",domain="",is_meta_leader="false",meta_leader="devops-nats-3.awide.tech",server_id="http://10.128.0.69:8222",server_name="devops-nats-1.awide.tech"} 0
# HELP jetstream_server_total_message_bytes Total number of bytes stored in JetStream
# TYPE jetstream_server_total_message_bytes gauge
jetstream_server_total_message_bytes{cluster="awide",domain="",is_meta_leader="false",meta_leader="devops-nats-3.awide.tech",server_id="http://10.128.0.69:8222",server_name="devops-nats-1.awide.tech"} 0
# HELP jetstream_server_total_messages Total number of stored messages in JetStream
# TYPE jetstream_server_total_messages gauge
jetstream_server_total_messages{cluster="awide",domain="",is_meta_leader="false",meta_leader="devops-nats-3.awide.tech",server_id="http://10.128.0.69:8222",server_name="devops-nats-1.awide.tech"} 0
# HELP jetstream_server_total_streams Total number of streams in JetStream
# TYPE jetstream_server_total_streams gauge
jetstream_server_total_streams{cluster="awide",domain="",is_meta_leader="false",meta_leader="devops-nats-3.awide.tech",server_id="http://10.128.0.69:8222",server_name="devops-nats-1.awide.tech"} 0
# HELP process_cpu_seconds_total Total user and system CPU time spent in seconds.
# TYPE process_cpu_seconds_total counter
process_cpu_seconds_total 0.53
# HELP process_max_fds Maximum number of open file descriptors.
# TYPE process_max_fds gauge
process_max_fds 1.048576e+06
# HELP process_open_fds Number of open file descriptors.
# TYPE process_open_fds gauge
...
connect dashboards 14725 and 2279, as described in the section Setting up Grafana.
check for data in the dashboards.
Monitoring PostgreSQL
To connect PostgreSQL to monitoring using Prometheus, follow these steps:
create a docker-compose.yml file on the node where PostgreSQL monitoring needs to be performed:
version: 3.9
services:
postgres_exporter:
    container_name: postgres_exporter
    image: prometheuscommunity/postgres-exporter
    environment:
    DATA_SOURCE_URI: "<IP_of_host_with_PostgreSQL>:<PostgreSQL_port>/<PostgreSQL_database>?sslmode=disable"
    DATA_SOURCE_USER: "<user_that_has_access_to_db_above>"
    DATA_SOURCE_PASS: "<password_from_user_with_access_to_db>"
    PG_EXPORTER_EXTEND_QUERY_PATH: "/etc/postgres_exporter/queries.yaml"
    volumes:
    - ./queries.yaml:/etc/postgres_exporter/queries.yaml:ro
    ports:
    9187:9187
    restart: unless-stopped
    deploy:
    resources:
        limits:
        cpus: '0.2'
        memory: 500M
    networks:
        - default

networks:
default:
    ipam:
    driver: default
    config:
        - subnet: 172.28.0.0/16
create a file queries.yaml in the same directory. It describes custom queries - queries that the user creates and optimizes independently to perform specific tasks - for PostgreSQL:
backend_rest_ip:
master: true
cache_seconds: 30
query: "select * from sys.base_config bc where bc.name='backend_rest'"
metrics:
    - id:
        usage: "COUNTER"
        description: "id description is here"
    - key:
        usage: "LABEL"
        description: "key desc is here"
    - name:
        usage: "LABEL"
        description: "name description is here"
    - value:
        usage: "LABEL"
        description: "value description is here"
    - description:
        usage: "LABEL"
        description: "description is here"

# example of other queries
error_count_in_logfile:
master: true
cache_seconds: 30
query: select count(*) from monitoring.v_logs;
metrics:
    - count:
        usage: "COUNTER"
        description: "Number of errors in the log"

metric_count_for_trigger:
master: true
cache_seconds: 30
query: select count(*) from  monitoring.v_metric_triggers;
metrics:
    - count:
        usage: "COUNTER"
        description: "Number of metrics for triggers"


latest_entry:
master: true
cache_seconds: 30
query: select metric_ts from monitoring.cv_metric_pg_stat_statements_sum order by metric_ts desc limit 1;
metrics:
    - metric_ts:
        usage: "COUNTER"
        description: "Oldest record (TTL check)"

top5_workers_with_errors:
master: true
cache_seconds: 30
query: select * from pipelinedb.proc_query_stats order by errors desc limit 5;
metrics:
    - type:
        usage: "LABEL"
    - pid:
        usage: "LABEL"
    - start_time:
        usage: "LABEL"
    - query_id:
        usage: "LABEL"
    - input_rows:
        usage: "LABEL"
    - output_rows:
        usage: "LABEL"
    - updated_bytes:
        usage: "LABEL"
    - input_bytes:
        usage: "LABEL"
    - executions:
        usage: "LABEL"
    - errors:
        usage: "COUNTER"
    - exec_ms:
        usage: "LABEL"

top5_streams_data_size:
master: true
cache_seconds: 30
    #query: select namespace, stream, input_rows,  pg_size_pretty(input_bytes) from pipelinedb.stream_stats order by input_bytes desc limit 5;
query: select namespace, stream, input_bytes from pipelinedb.stream_stats order by input_bytes desc limit 5;
metrics:
    - namespace:
        usage: "LABEL"
    - stream:
        usage: "LABEL"
    - input_bytes:
        usage: "COUNTER"

backend_rest_ip:
master: true
cache_seconds: 30
query: select * from sys.base_config bc where bc.name='backend_rest';
metrics:
    - id:
        usage: "COUNTER"
    - key:
        usage: "LABEL"
    - name:
        usage: "LABEL"
    - value:
        usage: "LABEL"
    - description:
        usage: "LABEL"
In the example above (block backend_rest_ip), there is information on the port on which the backend is running. If there is no data or errors occur, change the UID value to the current one.
Another way to monitor PostgreSQL is to connect the required database through Data Source in Grafana and execute queries to collect metrics directly through the database. After clicking the “Save and test” button, you may see an error if the fields were filled incorrectly.
add an entry to the pg_hba.conf file to provide access from the network where the docker container is running (in the example above, the default range of such addresses is - 172.28.0.0/16):
...
host    all     all   172.28.0.0/16   md5
...
restart PostgreSQL;
start the postgres-exporter service:
docker-compose up -d
check that the metrics appeared on the port (in the example above, this is port 9187):
curl http://10.128.0.73:9187/metrics -s | grep backend_rest_ipIn response, you will receive metrics:
# HELP backend_rest_ip_id id description is here
# TYPE backend_rest_ip_id counter
backend_rest_ip_id{description="backend rest api",key="base",name="backend_rest",server="10.128.0.73:5432",value="10.128.0.81:5666"} 5
The above query focuses on a custom (user-defined) metric. If it is going to — the entire set of provided PostgreSQL metrics is being collected.
add a scrape job in prometheus.yml and restart the service. The restart command is executed from the directory containing the docker-compose.yml file used to start the prometheus service:
vim <path_to_prometheus.conf_file>
...
- job_name: postgresql
    scrape_interval: 5s
    static_configs:
    - targets:
        - - 10.128.0.73:9187  #<ip_with_running_postgres_exporter>:<postgres_exporter_port>
    relabel_configs:
    - source_labels: [__address__]
        target_label: __param_target
    - source_labels: [__param_target]
        target_label: instance
...

# restart the service
docker-compose kill -s SIGHUP prometheus
add the modified dashboard through the JSON model. The ID of the original dashboard is 9628 . To do this:
Return to the Grafana interface. In the left menu, select the “Dashboards” tab (number 1 in the image below).
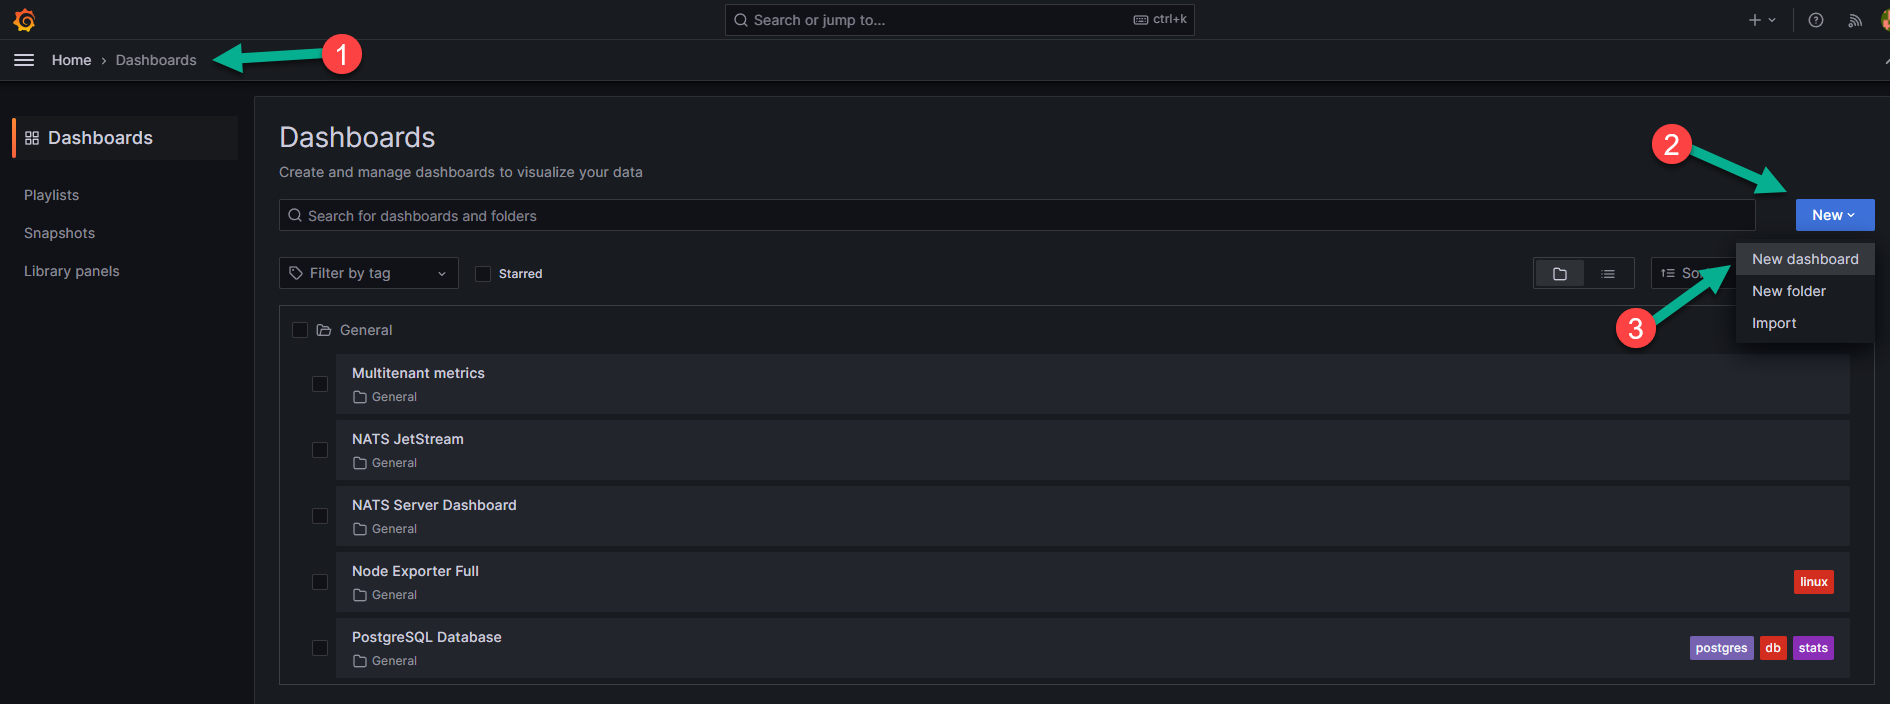
Click “New”, number 2 in the figure above, and select the “New dashboard” option), indicated by number 3 in the figure above from the dropdown menu.
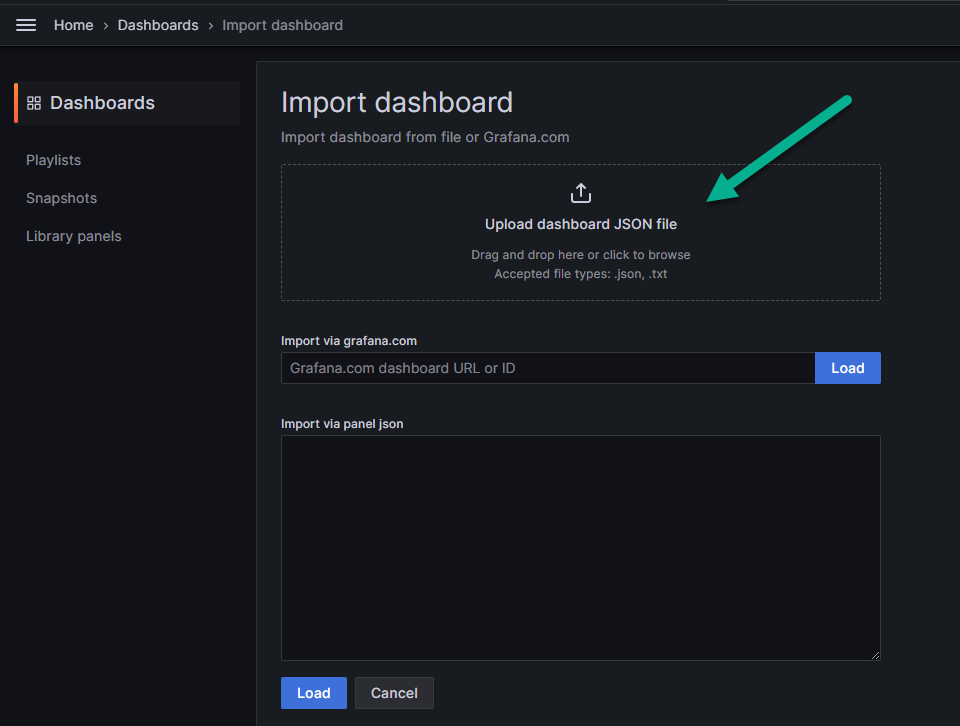
In the field indicated by the arrow in the image below, upload the downloaded json file with the modified dashboard.
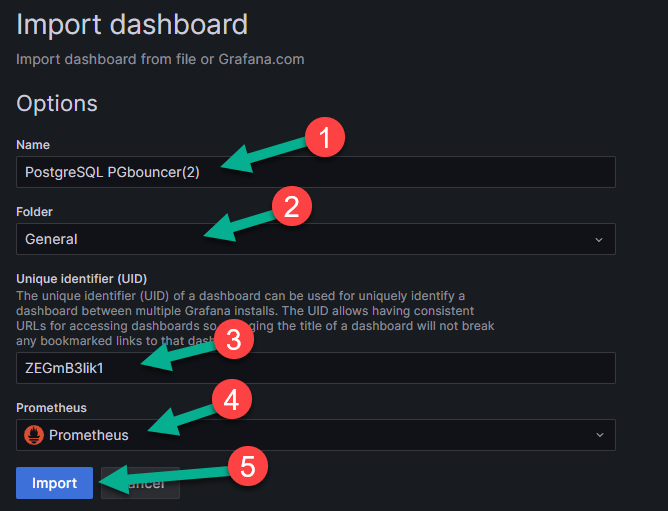
On the page that appears, fill in the empty fields:
name — the name of the dashboard (number 1 in the image below);
folder — the folder in which it will be displayed (number 2 in the image below);
unique identifier — the unique identification number of the dashboard (number 3 in the image below);
data source — in this case, Prometheus (number 4 in the image below).
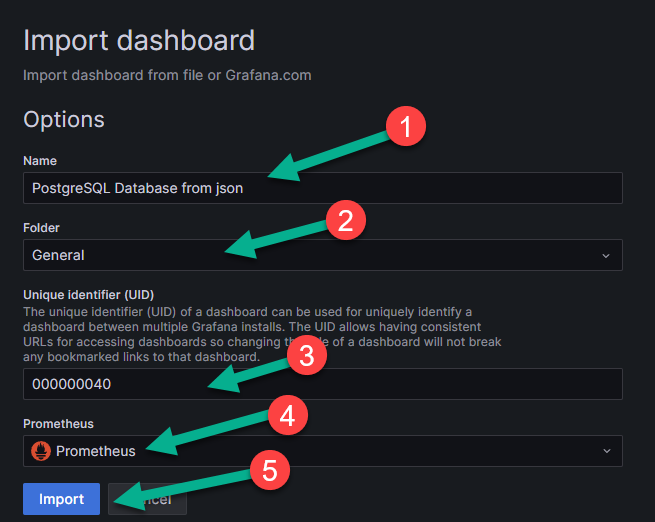
Save the dashboard by clicking the “Import” button (number 5 in the figure above).
Note
The exported dashboard in the JSON structure may have UIDs of the test installation. If there is no data or errors appear, change the UID value to the current one.
Another way to monitor PostgreSQL is to connect the required database through Data Source in Grafana and execute queries to collect metrics directly through the database. Let’s review creating a Prometheus user to connect to the database (the role name can be changed if necessary):
Create a user and grant the necessary rights:
# all commands are executed after connecting to the pma database

create role prometheus with password 'prometheus';
grant CONNECT on DATABASE pma to prometheus;
GRANT SELECT ON ALL TABLES IN SCHEMA public TO prometheus;
alter role prometheus with login;

grant USAGE on SCHEMA monitoring TO prometheus;
grant USAGE on SCHEMA pipelinedb TO prometheus;
grant USAGE on SCHEMA sys TO prometheus;
GRANT SELECT ON ALL TABLES IN SCHEMA monitoring TO prometheus;
GRANT SELECT ON ALL TABLES IN SCHEMA pipelinedb TO prometheus;
GRANT SELECT ON ALL TABLES IN SCHEMA sys TO prom?theus;
Connect PostgreSQL as a data source. To do this, follow these steps:
Go to the menu on the left (number 1 in the image below) and select the “Data sources” item (number 2 in the image below), which is located in the “Connections” block.
On the page that appears, select PostgreSQL from the list of sources (number 2 in the image below).
Fill in the required fields:
PostgreSQL Connection — specify the PostgreSQL connection parameters:
Name — the name of the database for connecting to it in Grafana;
Host — the IP address of your database;
Database — the actual name of the database as defined on your server;
User — the user under which you will connect to the database;
Password — the user’s password for connection;
TSL/SSL mode — in the menu, you can enable or disable TSL/SSL verification mode. To enable it, an SSL certificate is required;
TSL/SSL method — you can choose the method for ensuring a secure connection between the client and the server over the internet.
TSL/SSL Auth details — when using TSL/SSL verification mode, provide authentication details: certificates and keys;
Connection limits — for a higher level of security, you can specify connection limits:
Max open — limits the number of simultaneously open connections to the database. This can be important to prevent server overload and ensure stable operation.
Max idle — sets the maximum idle time for a connection after which it will be closed. This helps free up server resources and prevent connection leaks.
Max lifetime — defines the maximum duration of a connection after which it will be automatically closed. This can be useful for ensuring safe and efficient operation with the database.
PostgreSQL details — provide additional details about PostgreSQL:
Version — the version you are using;
TimescaleDB — you can enable or disable the extension for the PostgreSQL database designed for working with time series data;
Min time interval — you can set the minimum time interval, which is recommended to be set according to your data recording cycle in the database.
Click “Save and test” to save all settings.
After you click “Save and test”, you may see an error if you filled in any fields incorrectly. For example, an error stating that such a database does not exist if you incorrectly filled in the field about its actual name.
If everything is filled in correctly, a message “Database connection OK” will appear about the successful connection to the database, and at this step, the connection to the DB will be completed, after which you can send a request directly to it, for which:
In the left menu, go to the “Dashboards” page. Click “New” on the right (as in the example above), and select “New dashboard” from the dropdown list.
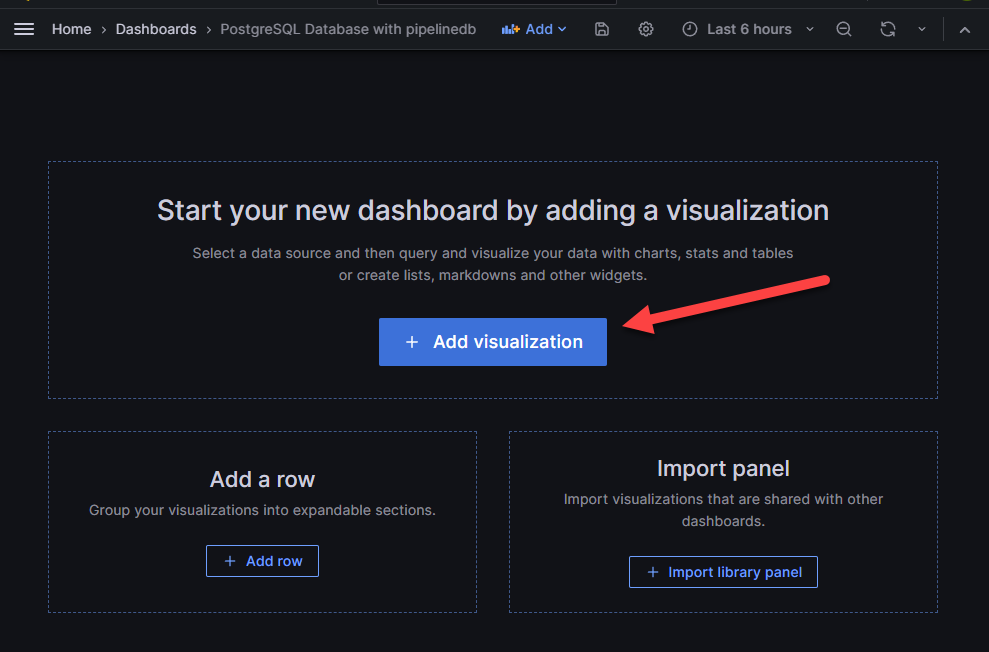
On the page that appears, select the rectangle with the option “Add visualization” shown by the arrow in the figure above. You will go to the next page:
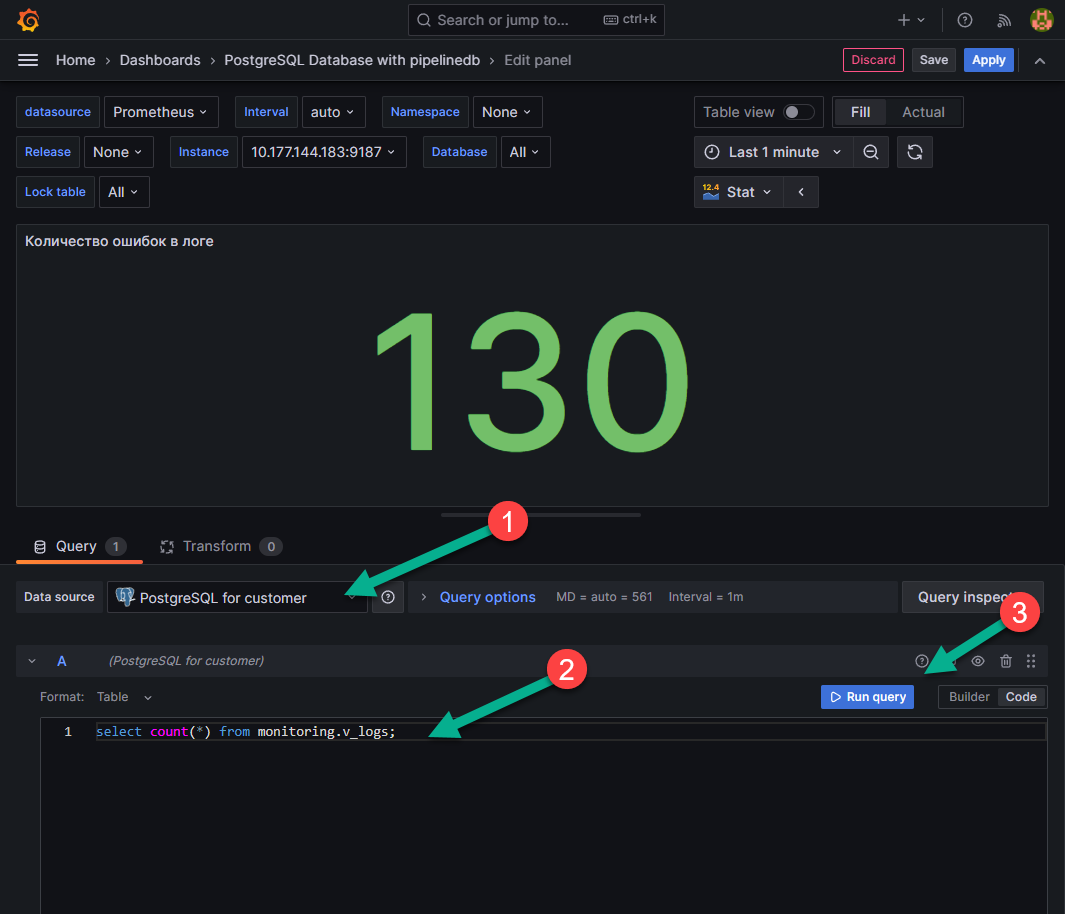
On the page that appears, in the “Data source” field, select “PostgreSQL for client” (number 1 in the figure above).
In the field indicated under number 2 in the figure above, you can write queries to the database and run them using the “Run query” button (number 3 in the figure above).
Monitoring PGBouncer
For monitoring, the exporter and dashboard for Grafana are used. This combination was chosen as it immediately supports the selection of a server for monitoring the database. The process of setting up monitoring is as follows:
on the node where monitoring of PGBouncer is needed, create a file docker-compose.yml and fill it in:
version: '3.9' services: pgbouncer_exporter_spreaker: container_name: pgbouncer_exporter_spreaker image: spreaker/prometheus-pgbouncer-exporter ports: - "9127:9127" environment: PGBOUNCER_EXPORTER_HOST: 0.0.0.0 # IP from which connections will be accepted PGBOUNCER_EXPORTER_PORT: 9127 # port where metrics will be available PGBOUNCER_HOST: <pgbouncer_ip> # IP address where PGbouncer is running PGBOUNCER_PORT: <pgbouncer_port> # port where PGbouncer is running PGBOUNCER_USER: <username_with_access_to_pgbouncer_db> # user with access to the pgbouncer database PGBOUNCER_PASS: <pass_from_user_with_access_to_pgbouncer_db> # password for the user with access to the pgbouncer database networks: - default

networks: default: ipam: driver: default config: - subnet: 172.28.0.0/16
add the node or the entire subnet where the container with the exporter is running (in the example above, the default range of such IP addresses is 172.28.0.0/16) to the pg_hba.conf file:
vim /etc/pgbouncer/pg_hba.conf

... host all all 172.28.0.0/16 md5 ...
restart the PGbouncer service;
check that the user can connect to the pgbouncer DB with the specified data:
psql -h <pgbouncer_ip> -p <pgbouncer_port> -U <username_with_access_to_pgbouncer_db> -d pgbouncer
If unable to connect, check for the specified user (and md5-hashed password):
vim /etc/pgbouncer/userlist.txt

... "<username_with_access_to_pgbouncer_db>" "md5 hashed <pass_from_user_with_access_to_pgbouncer_db>" ...
start the service pgbouncer_exporter_spreaker:
docker-compose up -d
check for metrics (<pgbouncer_ip>:<pgbouncer_port>) using the command:
curl <pgbouncer_ip>:<pgbouncer_port> -s
The response will contain metrics:
# HELP python_gc_objects_collected_total Objects collected during gc
# TYPE python_gc_objects_collected_total counter
python_gc_objects_collected_total{generation="0"} 92.0 python_gc_objects_collected_total{generation="1"} 274.0 python_gc_objects_collected_total{generation="2"} 0.0
# HELP python_gc_objects_uncollectable_total Uncollectable object found during GC
# TYPE python_gc_objects_uncollectable_total counter
python_gc_objects_uncollectable_total{generation="0"} 0.0 python_gc_objects_uncollectable_total{generation="1"} 0.0 python_gc_objects_uncollectable_total{generation="2"} 0.0
# HELP python_gc_collections_total Number of times this generation was collected
# TYPE python_gc_collections_total counter
python_gc_collections_total{generation="0"} 55.0 python_gc_collections_total{generation="1"} 5.0 ...
add a scrape job to prometheus.yml and restart the service. The restart command is executed from the directory containing the file docker-compose.yml, which was used to start the prometheus service. The exporter does not support multi-target configuration, so a separate job_name element needs to be created for each node pgbouncer:
vim <path_to_prometheus.conf_file> ... - job_name: pgbouncer_spreaker scrape_interval: 5s static_configs: - targets: - <pgbouncer_ip>:<pgbouncer_port> relabel_configs: - source_labels: \[ __address__ ] target_label: hostname regex: <pgbouncer_ip>:<pgbouncer_port> replacement: hostname_you_want_to_see_in_grafana_dashboard ...

# restart the service
docker-compose kill -s SIGHUP prometheus
add to Grafana dashboard. To do this, follow these steps:
On the “Dashboards” tab (number 1 in the image below), click “New”, number 2 in the image below, and select the “New dashboard” option (“New dashboard”), indicated by number 3 in the image below from the dropdown menu.

In the field indicated by the arrow in the image below, upload the downloaded json file with the modified dashboard.

Fill in the empty fields on the appeared page (numbers 1,2,3,4 in the image below) and click “Import” (number 5 in the image below).
Note
the exported dashboard in the JSON structure may have UIDs from the test installation. If there is no data or an error occurs, change the UID value to the current one.
NGINX monitoring
The basic version of NGINX provides very few parameters that can be monitored. Various modules that expand logging functionality (including through Telegraf) were tested, but the results did not meet expectations, so it was decided to stick with the basic monitoring functionality.
The configuration below will use port numbers. These are not recommended values, but only those on which this installation was tested and works. When using other ports, change them in the corresponding files. To set up monitoring, complete the following steps:
add the stub_state module to the NGINX configuration file, which will provide metrics:
server { listen 9999; location /metrics { stub_state; access_log off; allow 127.0.0.1; allow 172.28.0.0/16; #deny all; } }
The module stub_state can be added to any conf file that is read by NGINX and included via the include directive in /etc/nginx/nginx.conf.
after adding the module, check the nginx syntax and restart the service:
sudo nginx -t nginx: the configuration file /etc/nginx/nginx.conf syntax is ok nginx: configuration file /etc/nginx/nginx.conf test is successful

# if no errors are found - restart the service
sudo systemctl restart nginx
After the operations, NGINX will provide metrics at http://<nginx_host_ip>:9999/metrics.
on the node where monitoring needs to be performed and NGINX is installed, create a directory prometheus and in it a file docker-compose.yml:
---
version: "3.9" services: nginx_exporter: container_name: nginx_exporter image: nginx/nginx-prometheus-exporter ports: - "9113:9113" command: -nginx.scrape-uri=http://<nginx_host_ip>:9999/metrics networks: - default

networks: default: ipam: driver: default config: - subnet: 172.28.0.0/16
start the services from the docker-compose.yml file:
docker-compose up -d
check the state of the container and its logs:
docker container ls -a

CONTAINER ID IMAGE COMMAND CREATED STATE PORTS NAMES e8f9d6345b58 nginx/nginx-prometheus-exporter "/usr/bin/nginx-prom…" 4 hours ago Up 4 hours 0.0.0.0:9113->9113/tcp, :::9113->9113/tcp nginx_exporter

docker logs nginx_exporter NGINX Prometheus Exporter version=0.11.0 commit=e4a6810d4f0b776f7fde37fea1d84e4c7284b72a date=2022-09-07T21:09:51Z, dirty=false, arch=linux/amd64, go=go1.19 2023/11/13 15:01:46 Starting... 2023/11/13 15:01:46 Listening on :9113 2023/11/13 15:01:46 NGINX Prometheus Exporter has successfully started
check the availability of metrics on port 9113:
curl http://10.177.144.185:9113/metrics -s
# HELP nginx_connections_accepted Accepted client connections
# TYPE nginx_connections_accepted counter
nginx_connections_accepted 5
# HELP nginx_connections_active Active client connections
# TYPE nginx_connections_active gauge
nginx_connections_active 1
# HELP nginx_connections_handled Handled client connections
# TYPE nginx_connections_handled counter
nginx_connections_handled 5
# HELP nginx_connections_reading Connections where NGINX is reading the request header
# TYPE nginx_connections_reading gauge
nginx_connections_reading 0
# HELP nginx_connections_waiting Idle client connections
# TYPE nginx_connections_waiting gauge
nginx_connections_waiting 0
# HELP nginx_connections_writing Connections where NGINX is writing the response back to the client
# TYPE nginx_connections_writing gauge
nginx_connections_writing 1
# HELP nginx_http_requests_total Total http requests
# TYPE nginx_http_requests_total counter
nginx_http_requests_total 3173
# HELP nginx_up State of the last metric scrape
# TYPE nginx_up gauge
nginx_up 1
# HELP nginxexporter_build_info Exporter build information
# TYPE nginxexporter_build_info gauge
nginxexporter_build_info{arch="linux/amd64",commit="e4a6810d4f0b776f7fde37fea1d84e4c7284b72a",date="2022-09-07T21:09:51Z",dirty="false",go="go1.19",version="0.11.0"} 1
add job to prometheus.yml:
... - job_name: nginx_exporter scrape_interval: 5s static_configs: - targets: - <nginx_host_ip>:9113 ...
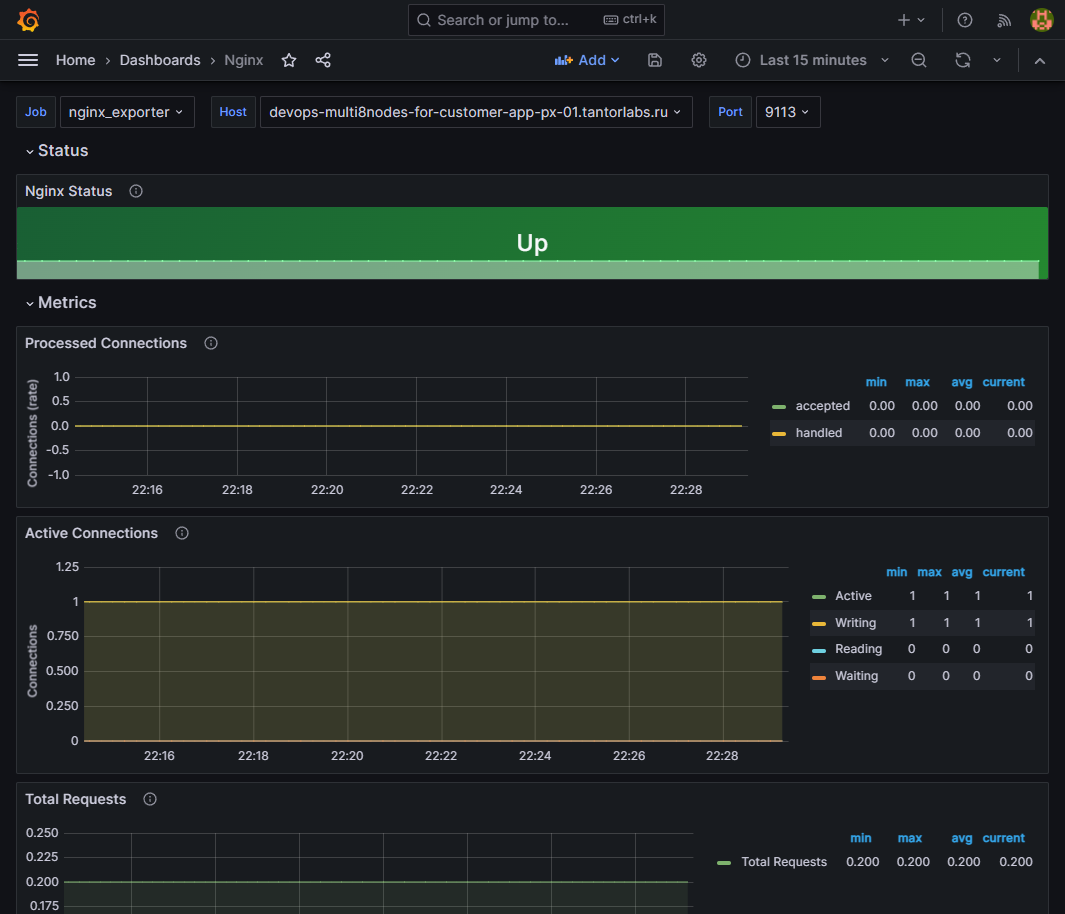
add dashboard in Grafana;
check for metrics in the added dashboard: