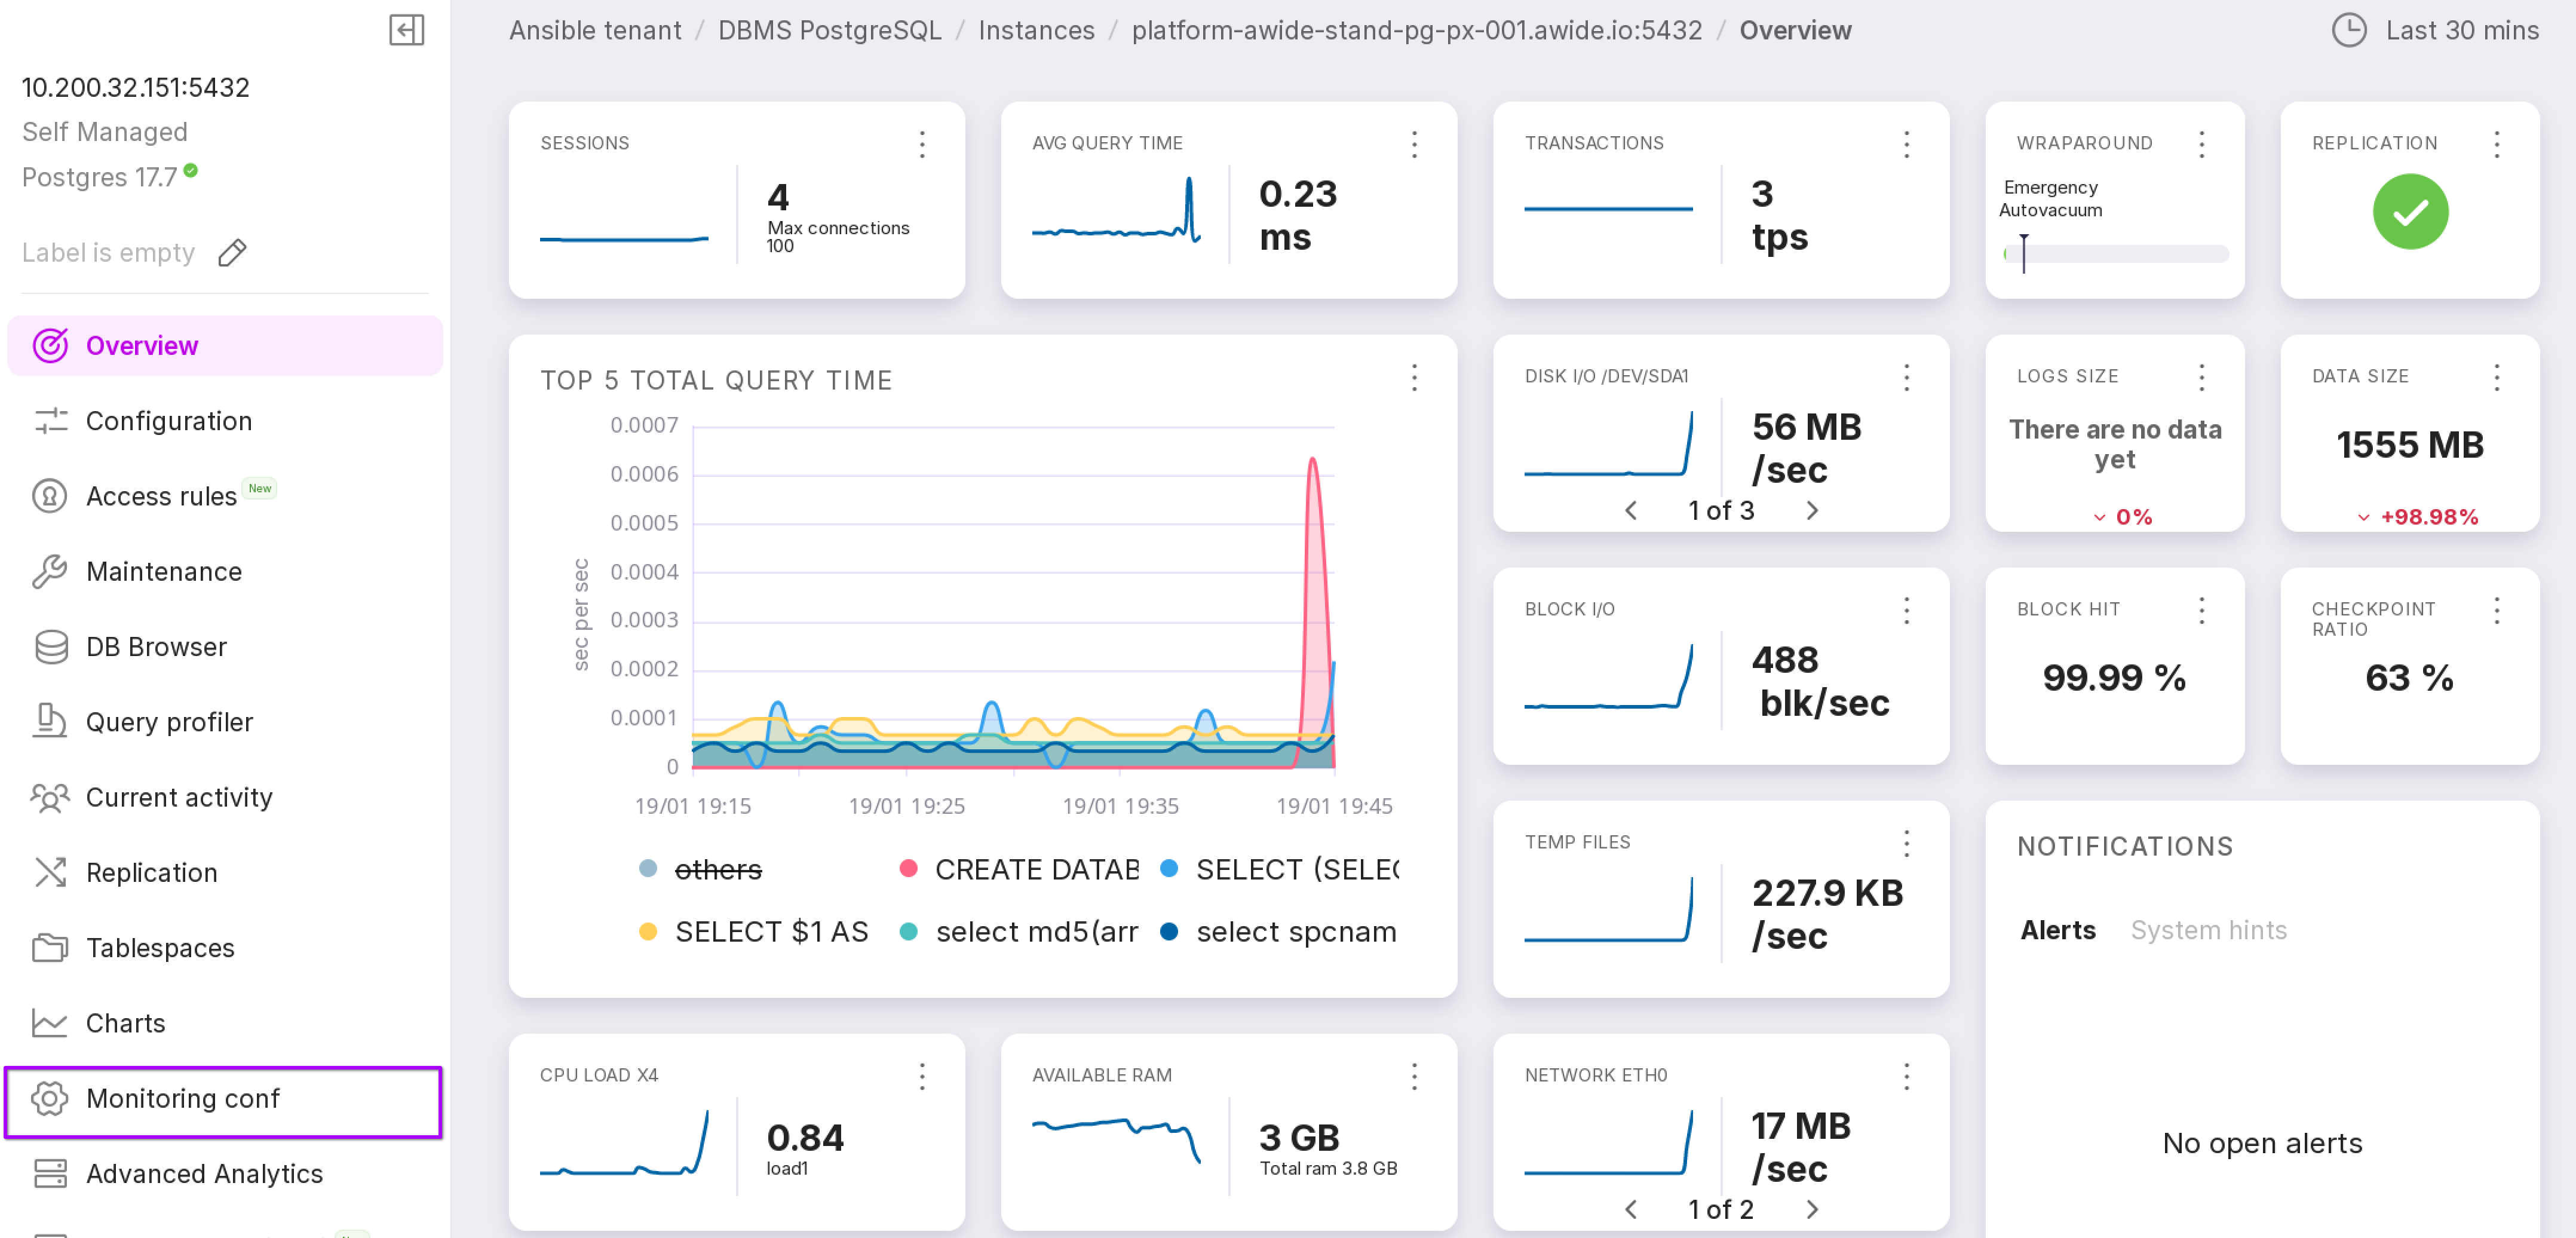
Monitoring configuration
On the “Monitoring Configuration” page, you can configure Agent and triggers.
Attention
This section of the instance is not available to a User with view-only rights.
To open this page, click on “Monitoring Conf” in the left menu panel of the instance.
The “Database List” tab
On this tab, you can configure Agent: specify which databases to monitor and the criteria for opening alerts.
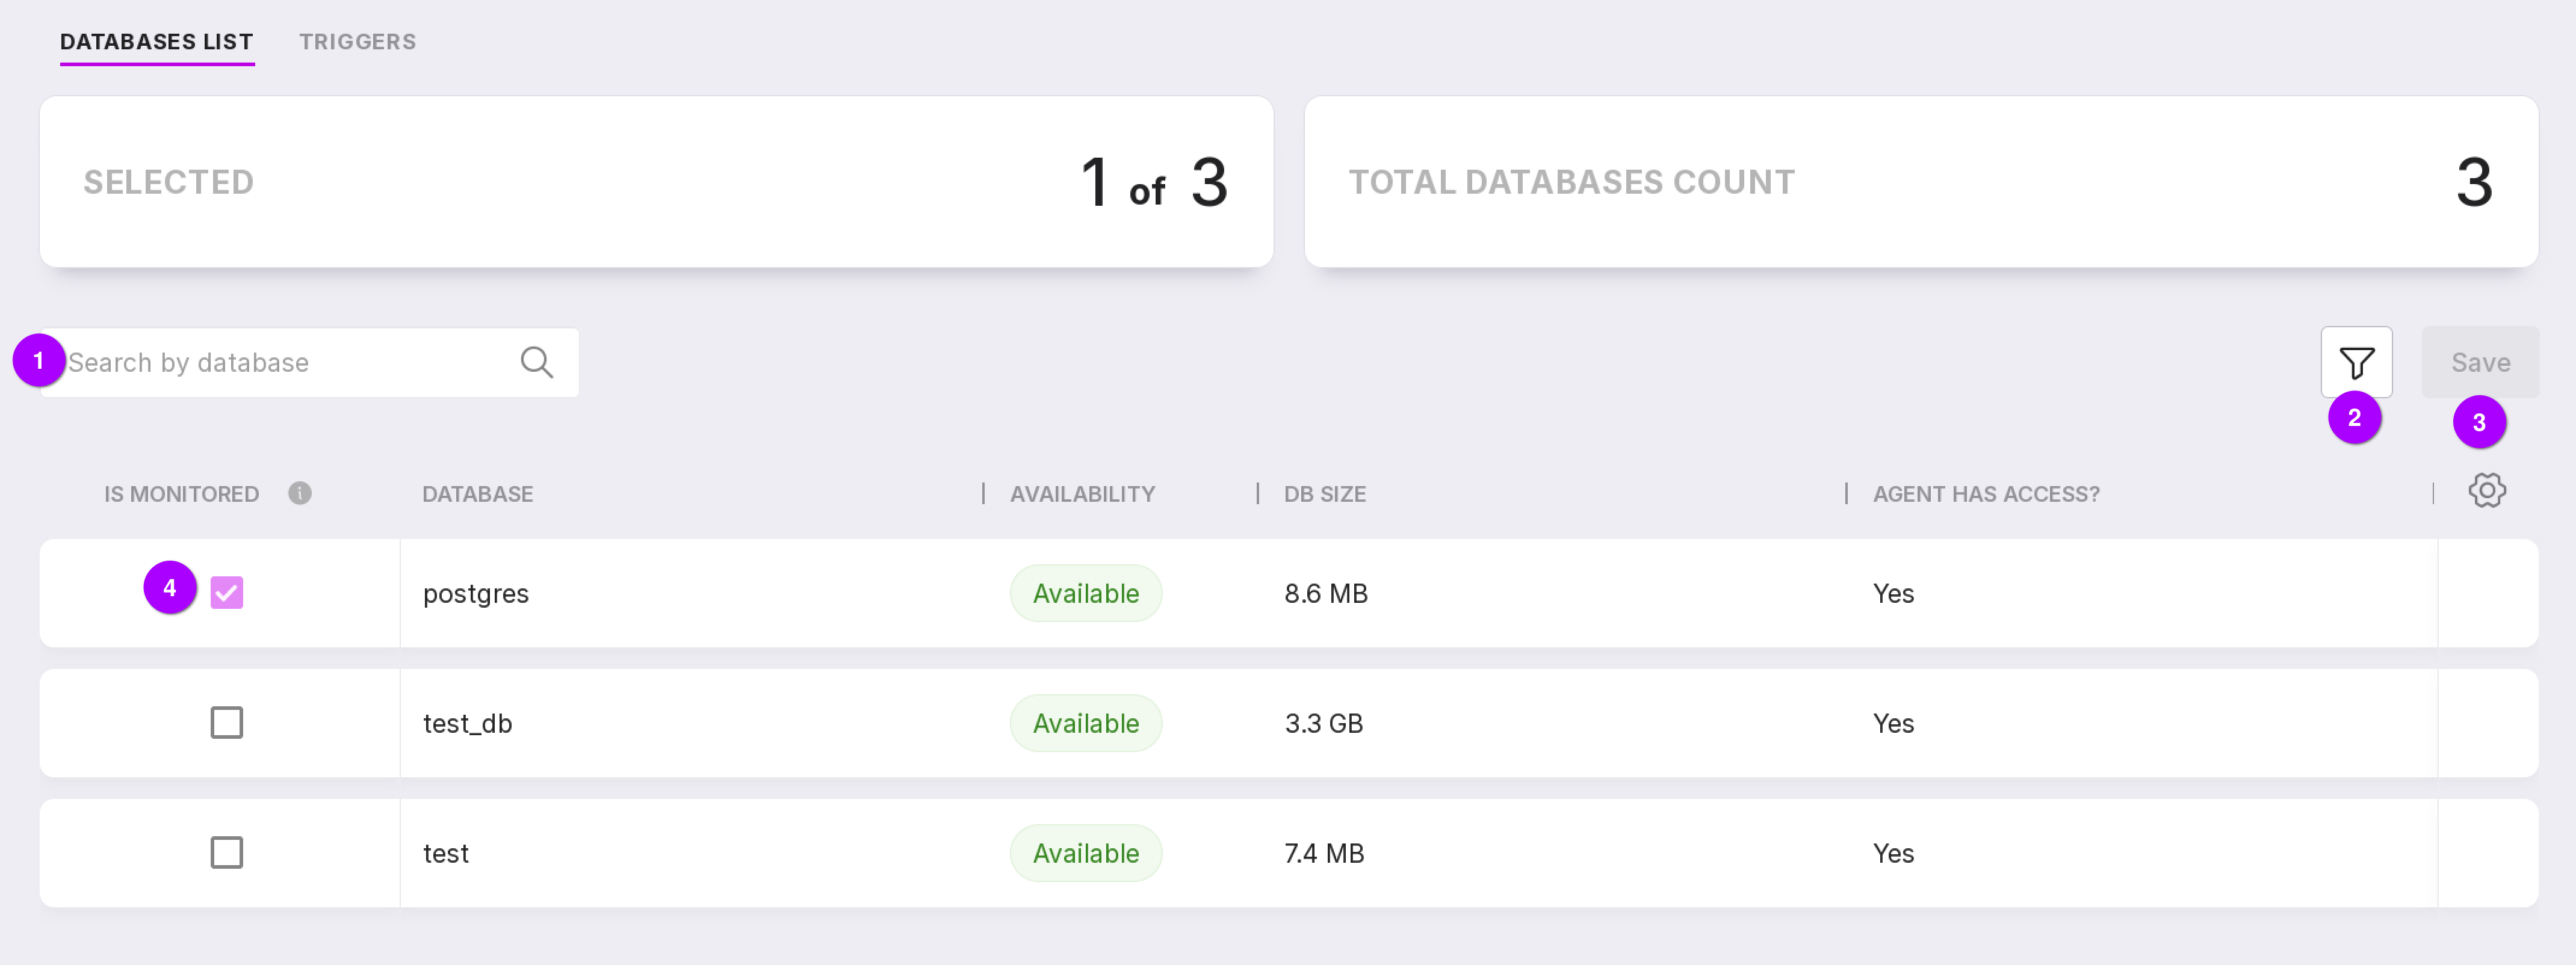
A search bar that can be used to search for information on the database.
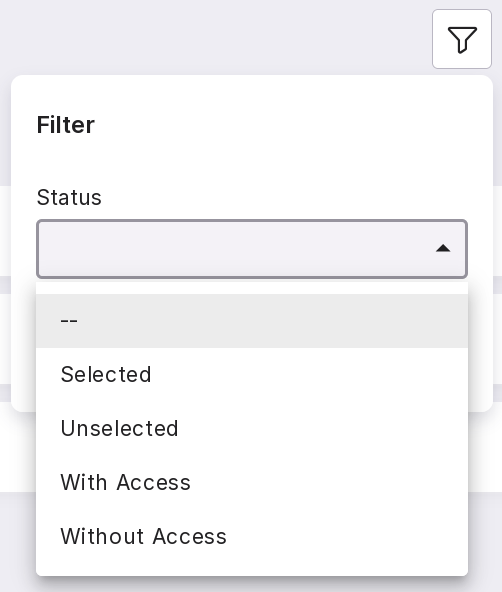
Databases can be filtered by states:
To apply the changes, click “Save”.
If the checkbox is checked, this database will be monitored.
The “Triggers” tab
A trigger is a pre-configured condition for creating alerts. If your collected PostgreSQL metrics exceed the trigger values, the system will create an alert.
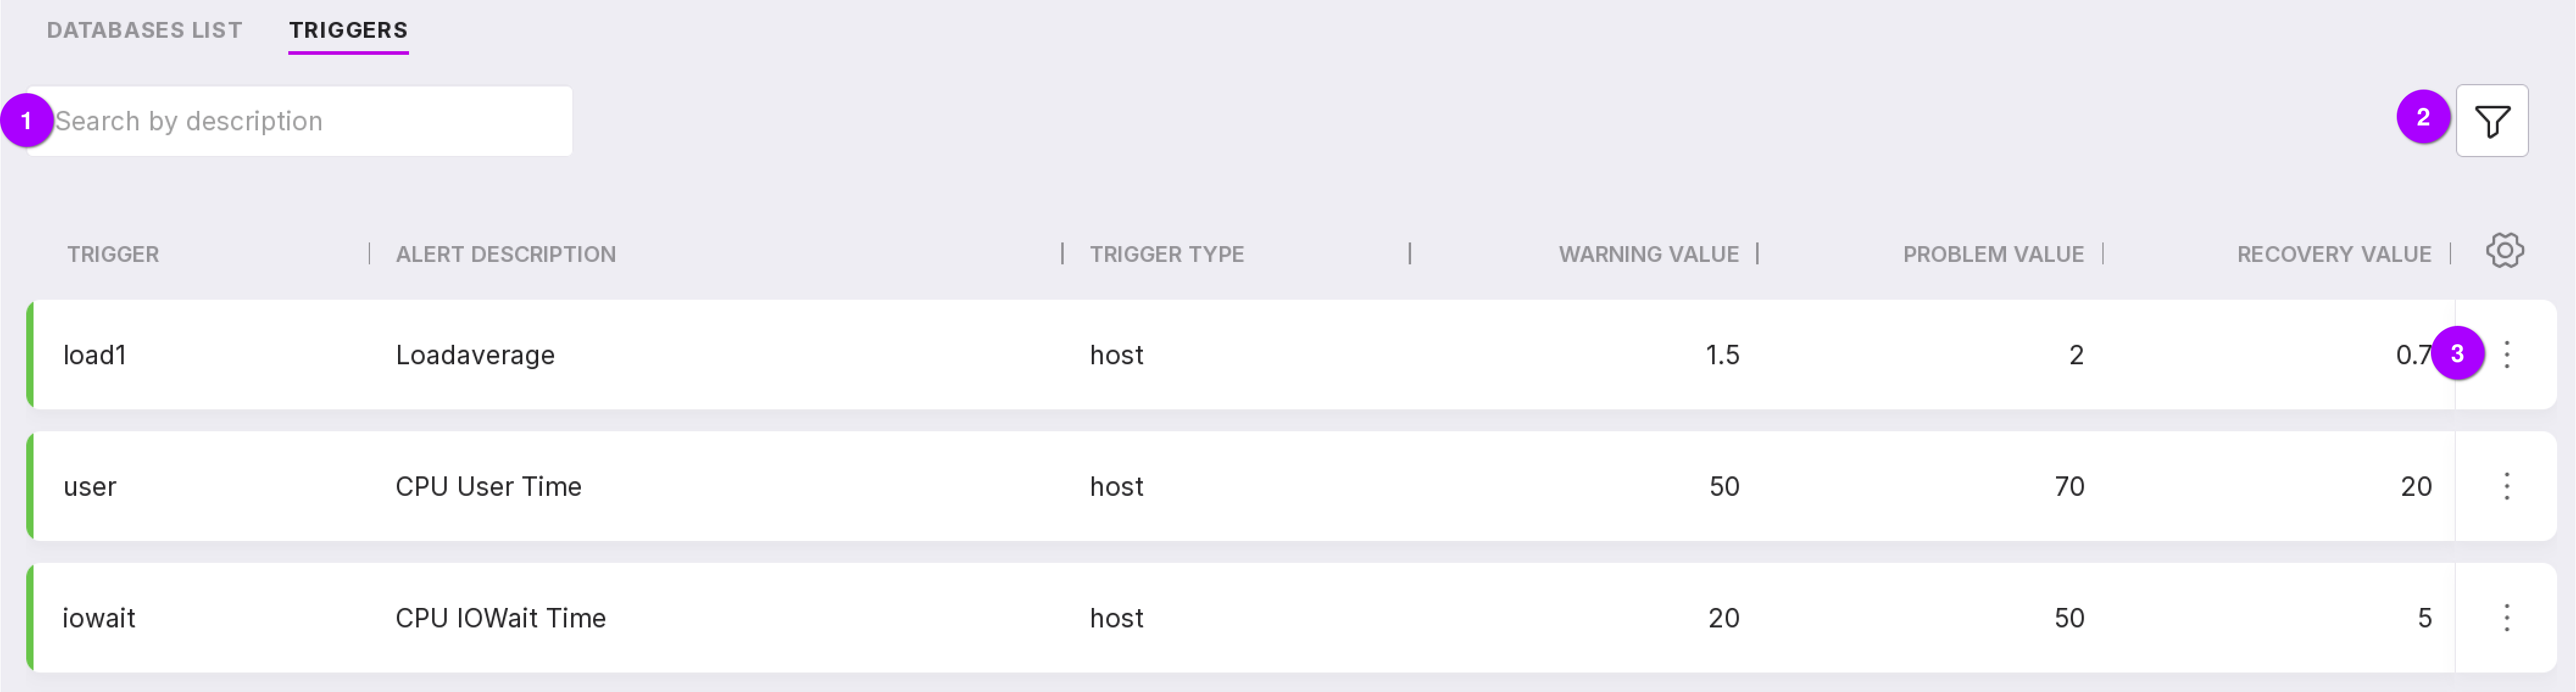
Let’s review the information on the page as numbered in the figure above:
Using the search bar, triggers can be searched by their description.
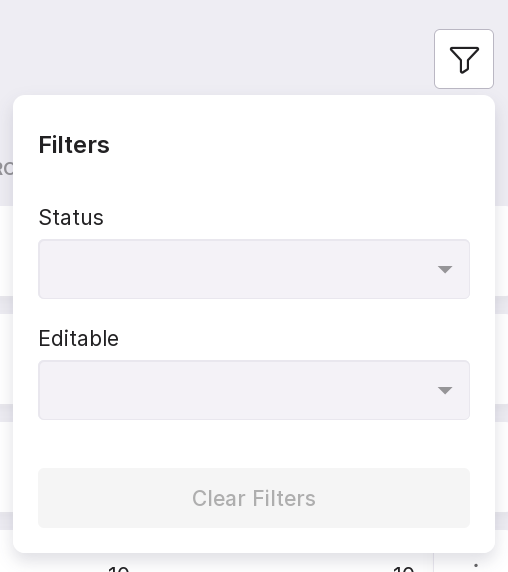
Triggers can be filtered by the following parameters:
state: enabled or disabled;
editability: editable or non-editable.
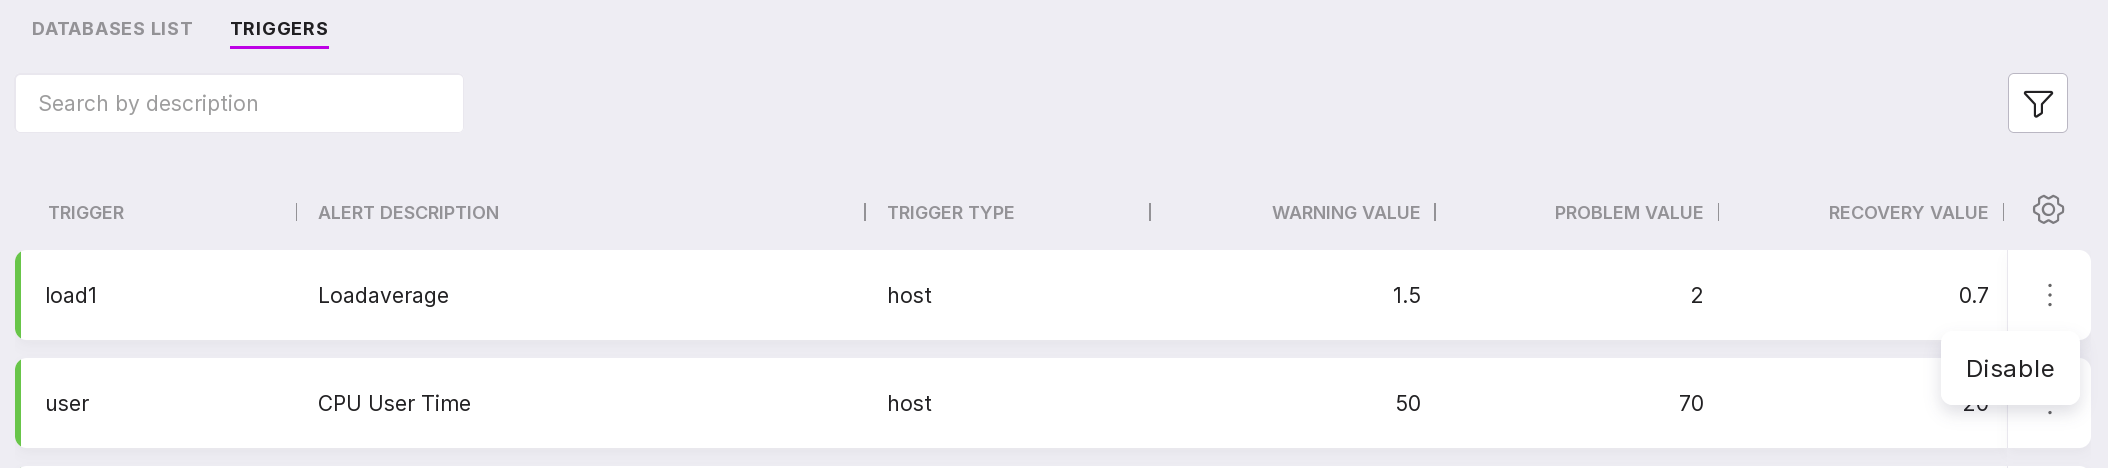
Through the menu, non-editable triggers can be enabled or disabled:
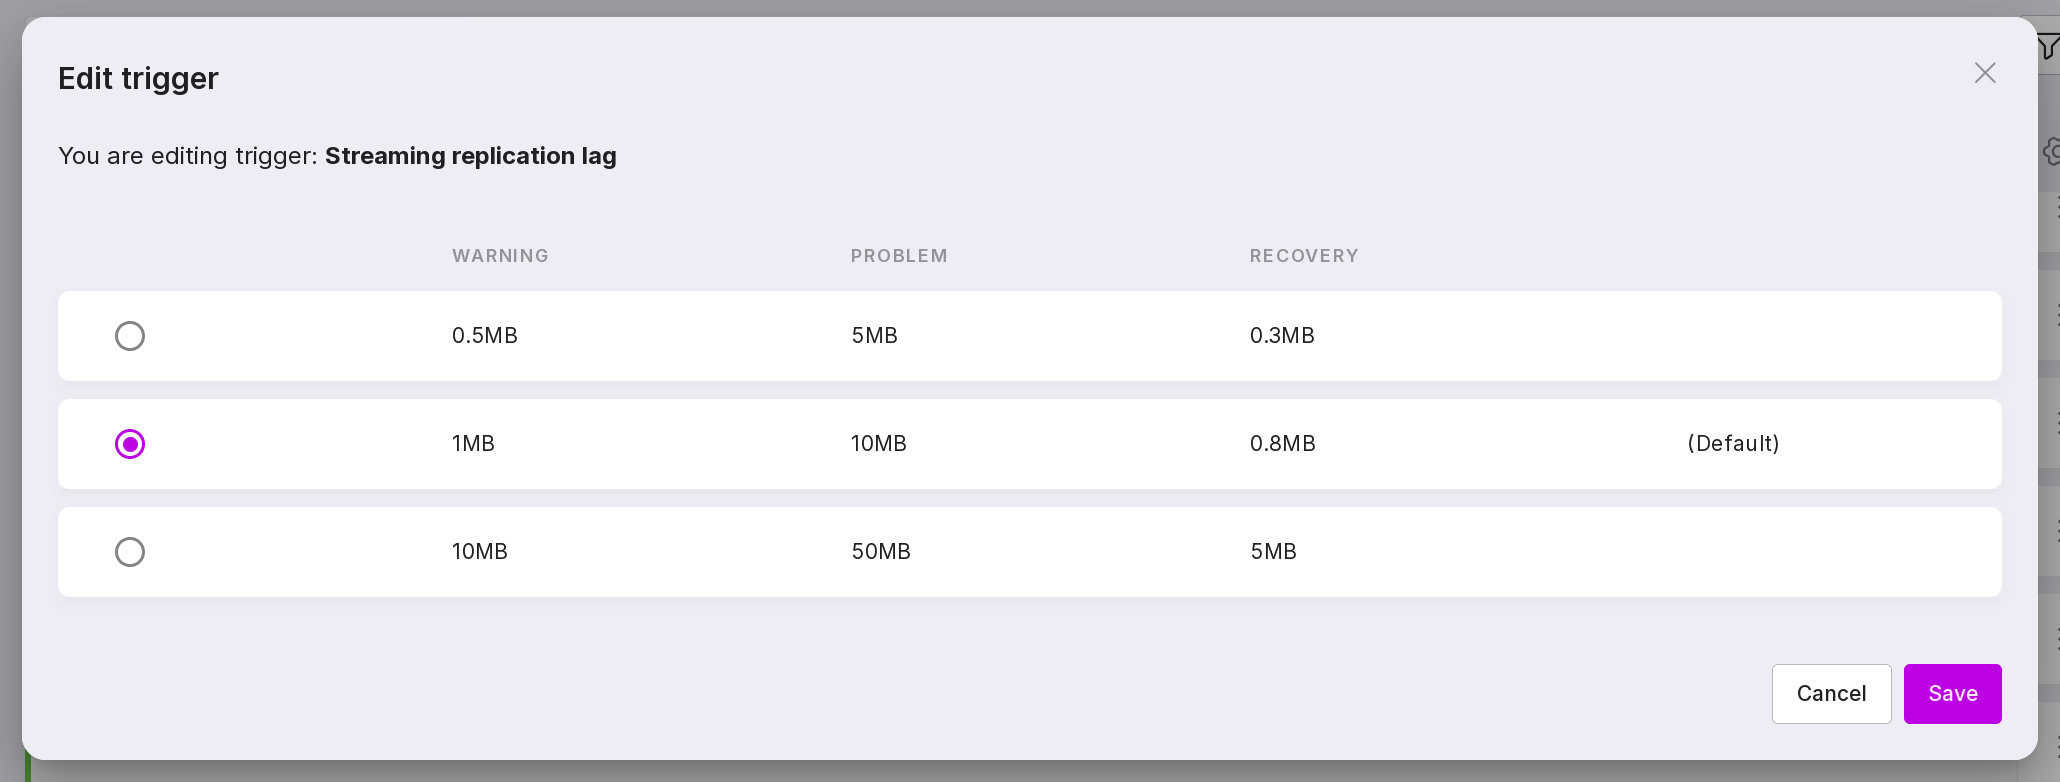
Editable triggers can be enabled or disabled, and you can also change the values of “Warning”, “Problem”, and “Recovery”:
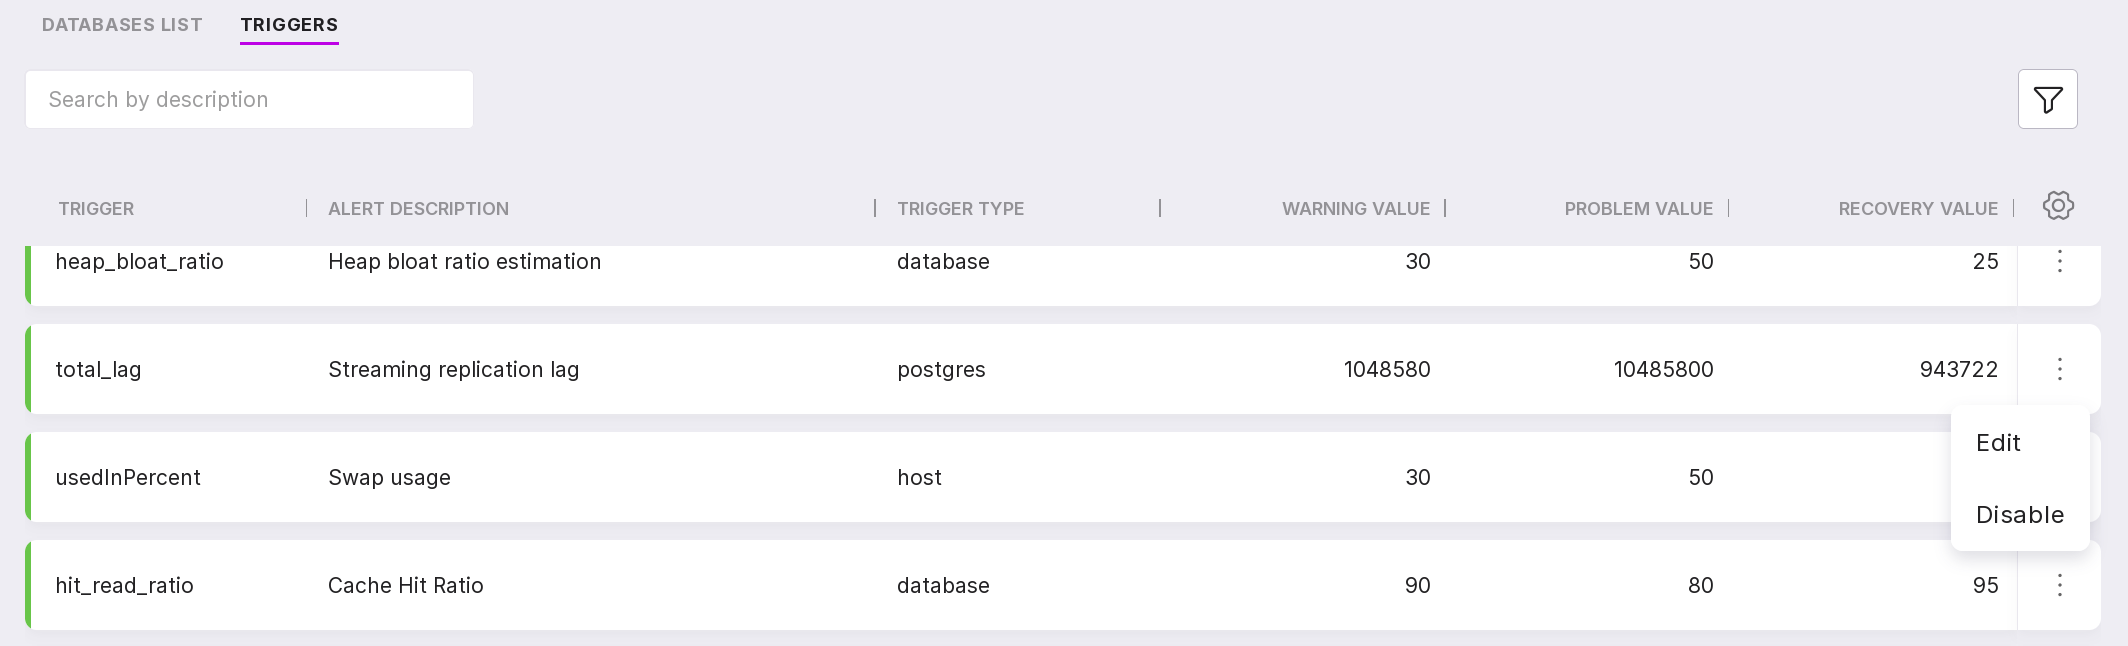
To edit the values:
Select “Edit” in the trigger menu.
Choose the option that best suits your PostgreSQL.
Click “Save” to confirm the changes.