DB Browser
The DB Browser is a tool that allows you to view and manage the contents of databases (perform all CRUD operations) from Platform without third-party software solutions.
Attention
This functional module of Platform is available:
only with an additional license;
only with Agent version 5.0 and above.
DB Browser Page
To open the page, select “DB Browser” from the left menu panel of the instance.
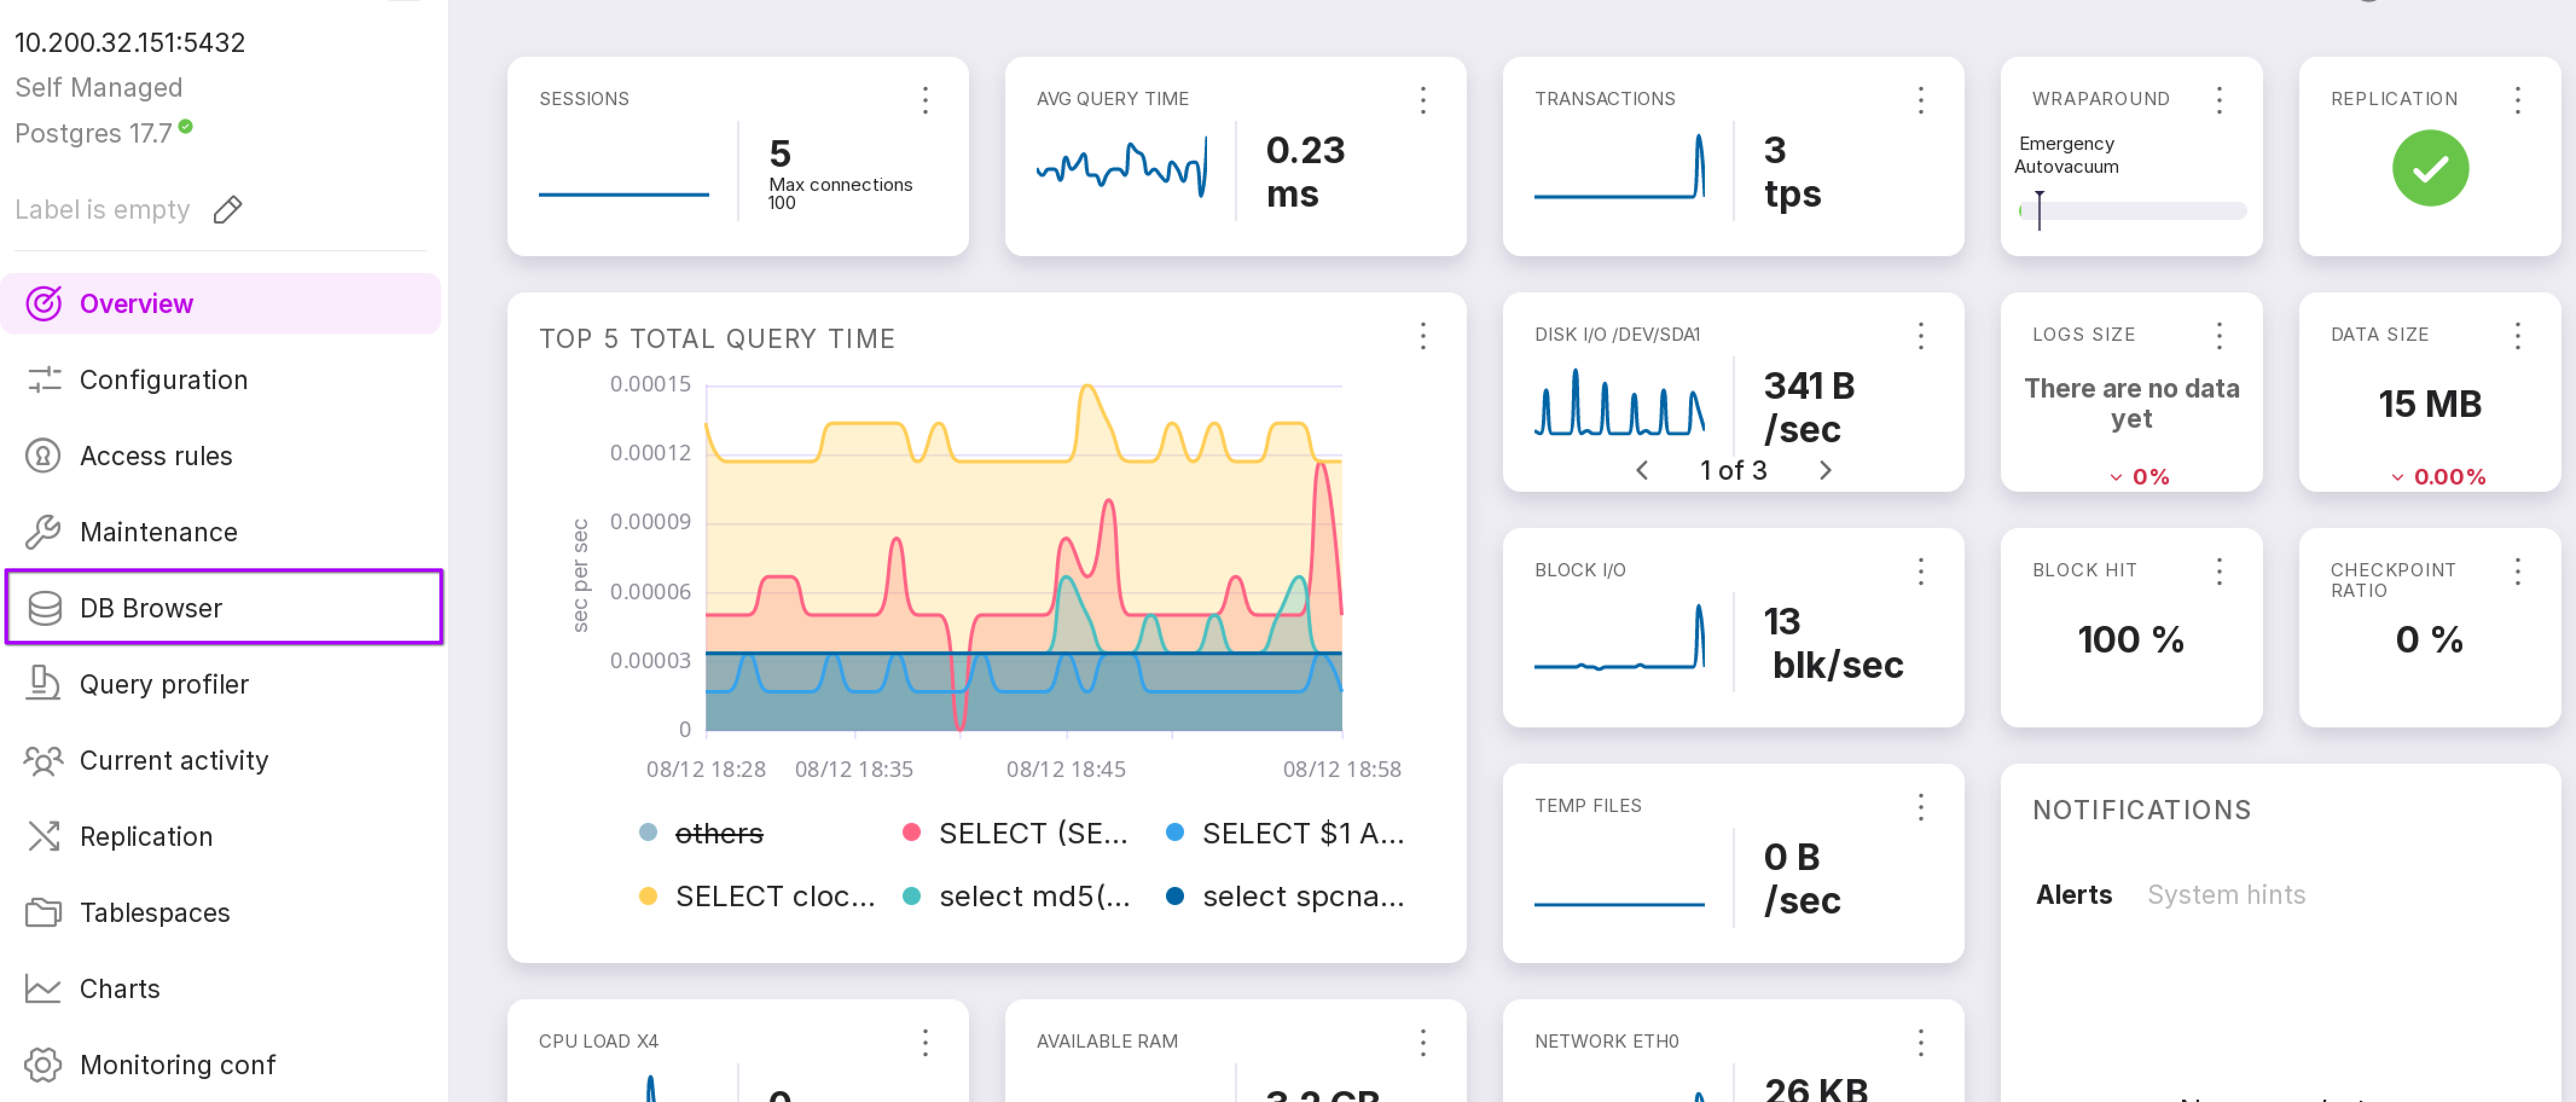
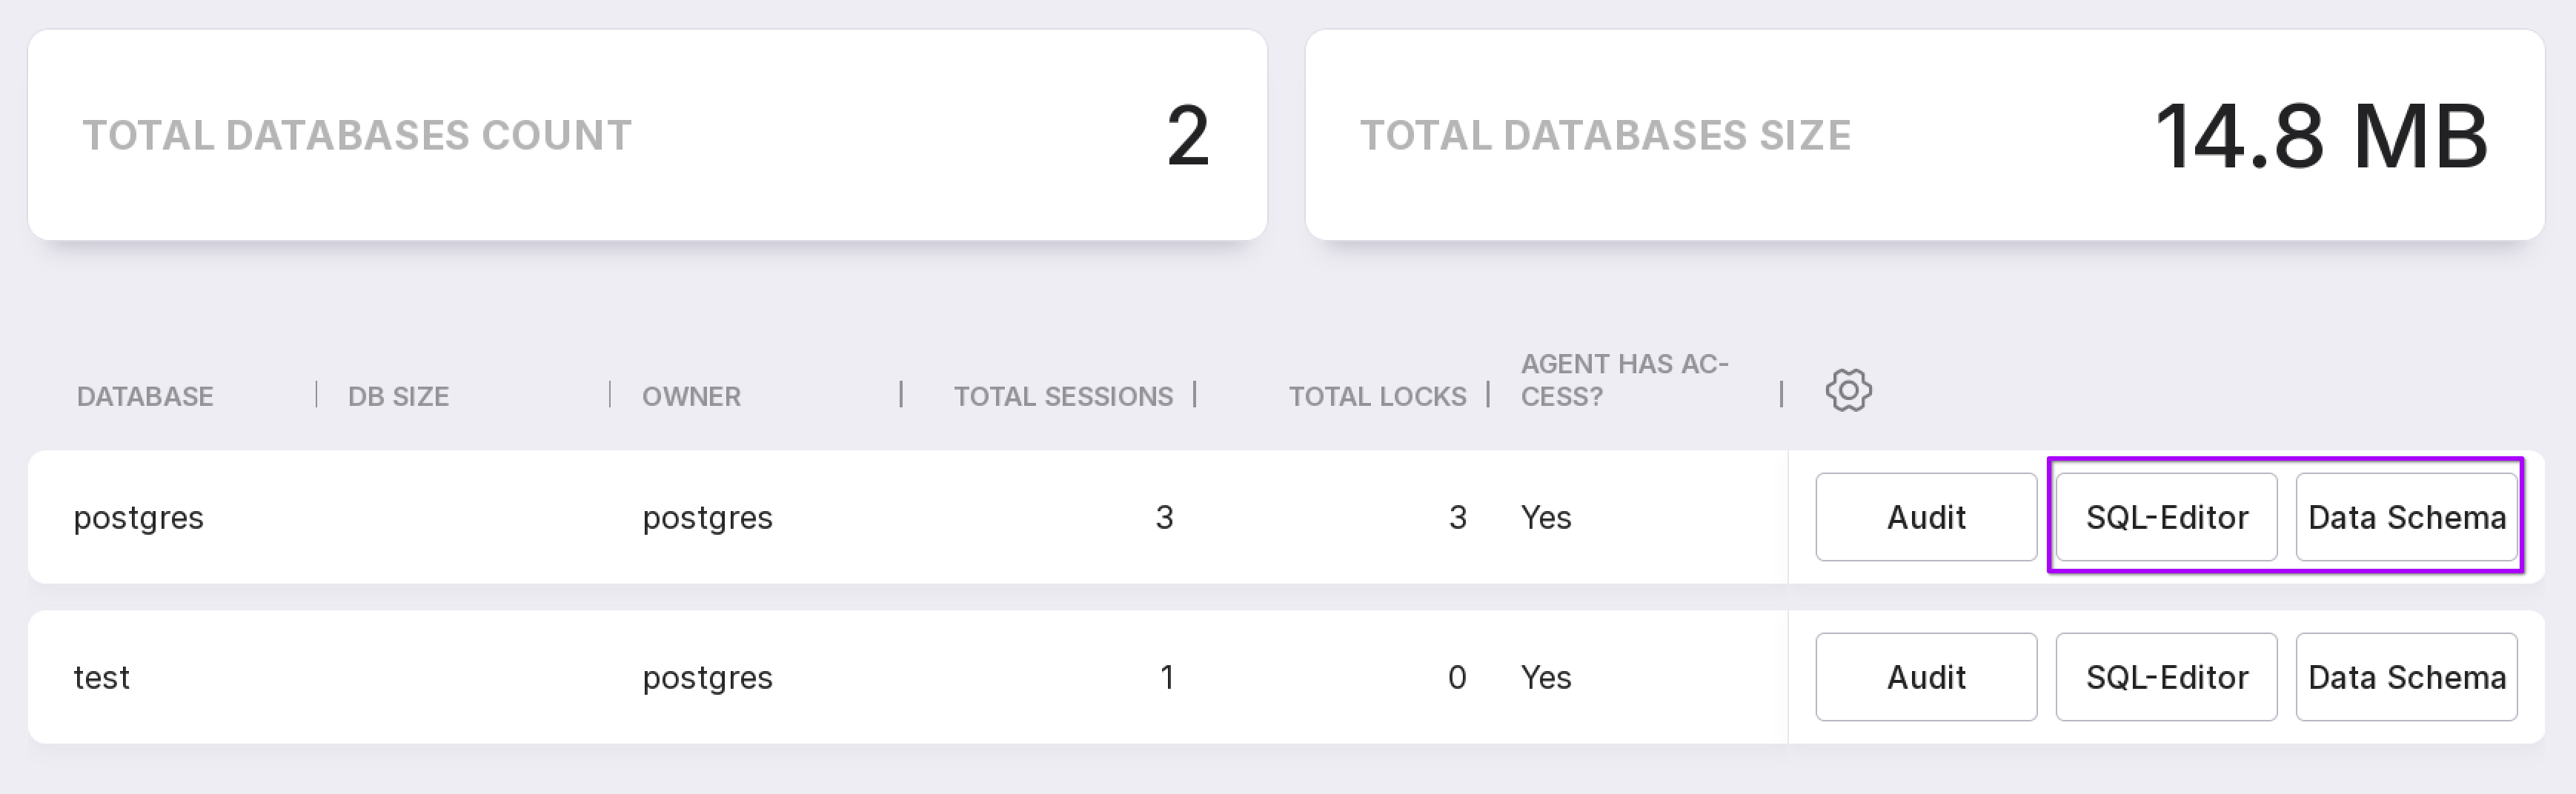
The page displays a list with information on the databases available in the PostgreSQL instance, as well as their count and total size.
Each database has three buttons: “Audit”, “SQL Editor” and “Data Schema.”
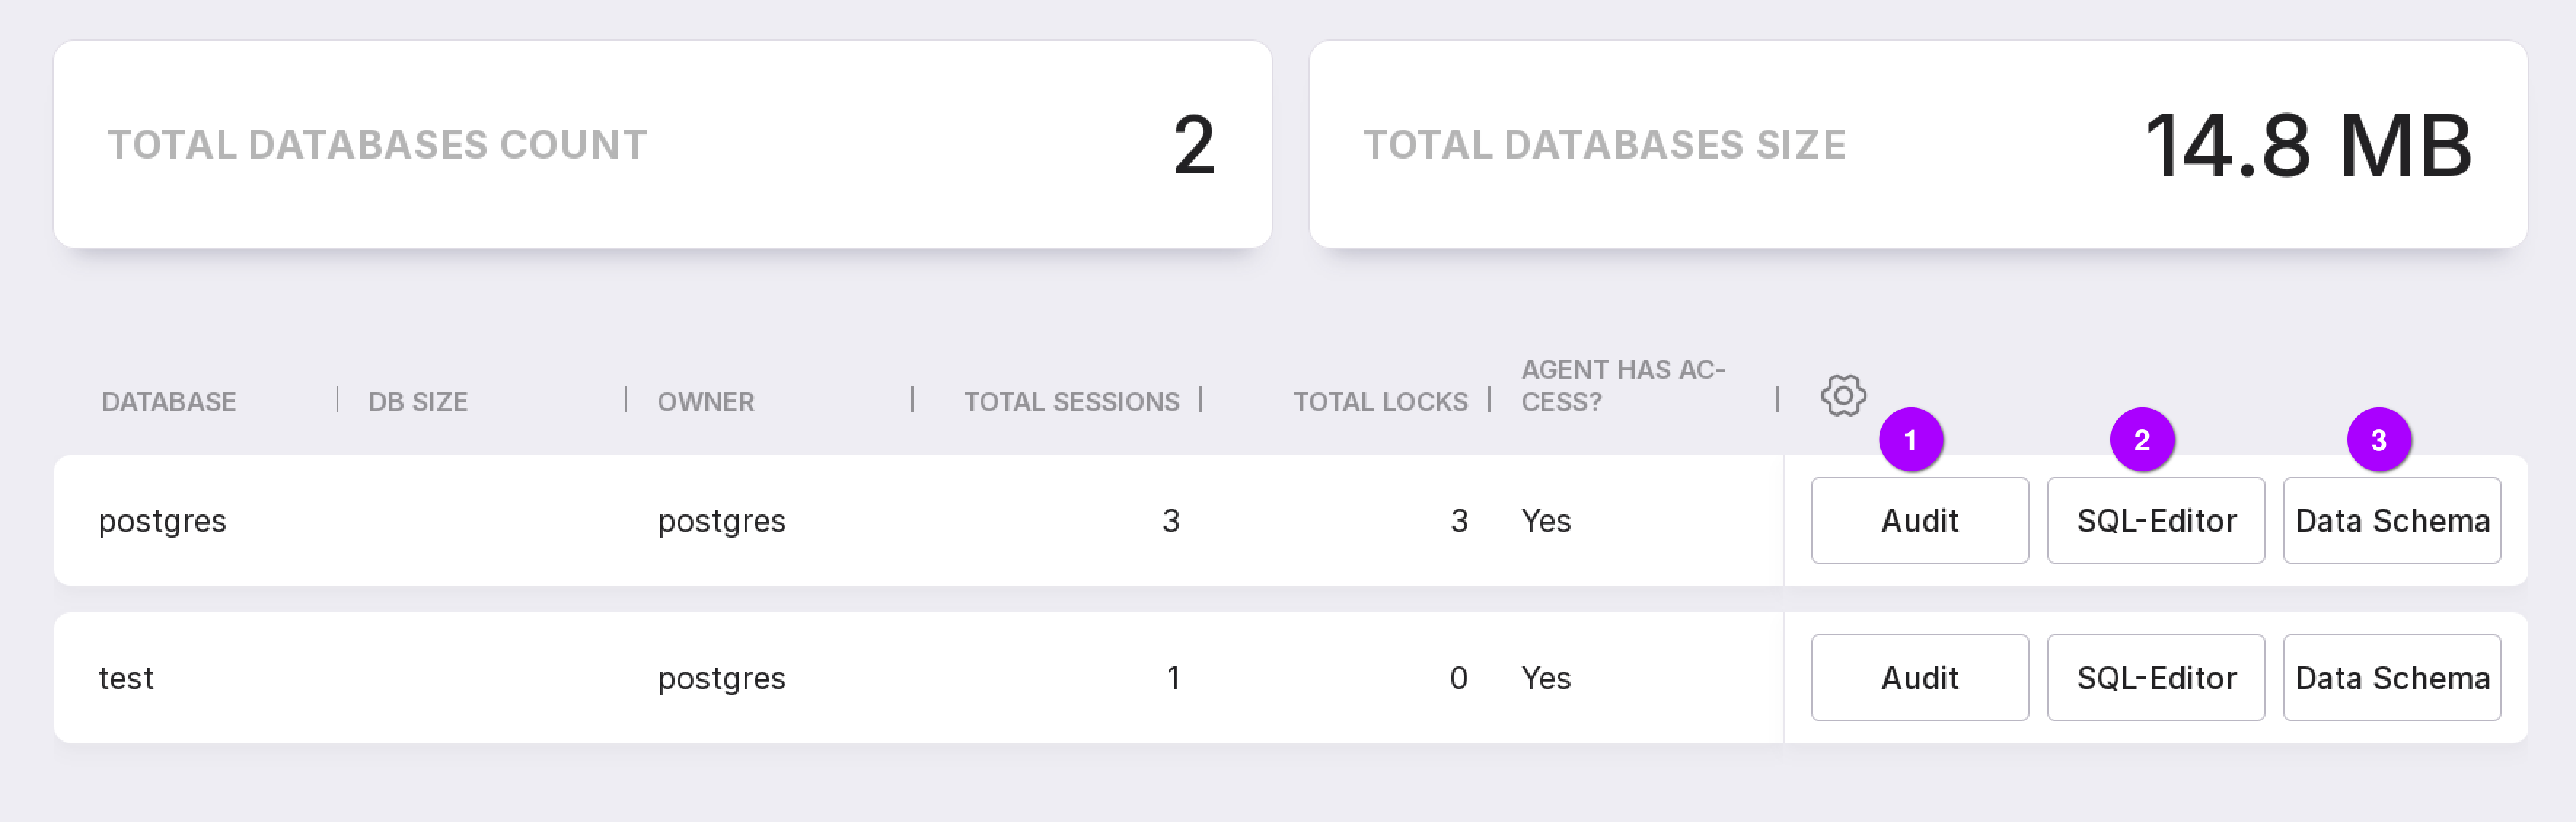
“Audit” opens the database inspection page with additional information on it.
“SQL Editor” allows you to connect to the database and open the DB Browser panel in the SQL editor tab.
“Data Schema” allows you to connect to the database and open the DB Browser panel.
Database Inspection Page
After clicking the “Audit” button, a page with detailed information on the database available in PostgreSQL will open.
Database
HEALTHCHECKS information is collected automatically when you enter the page.
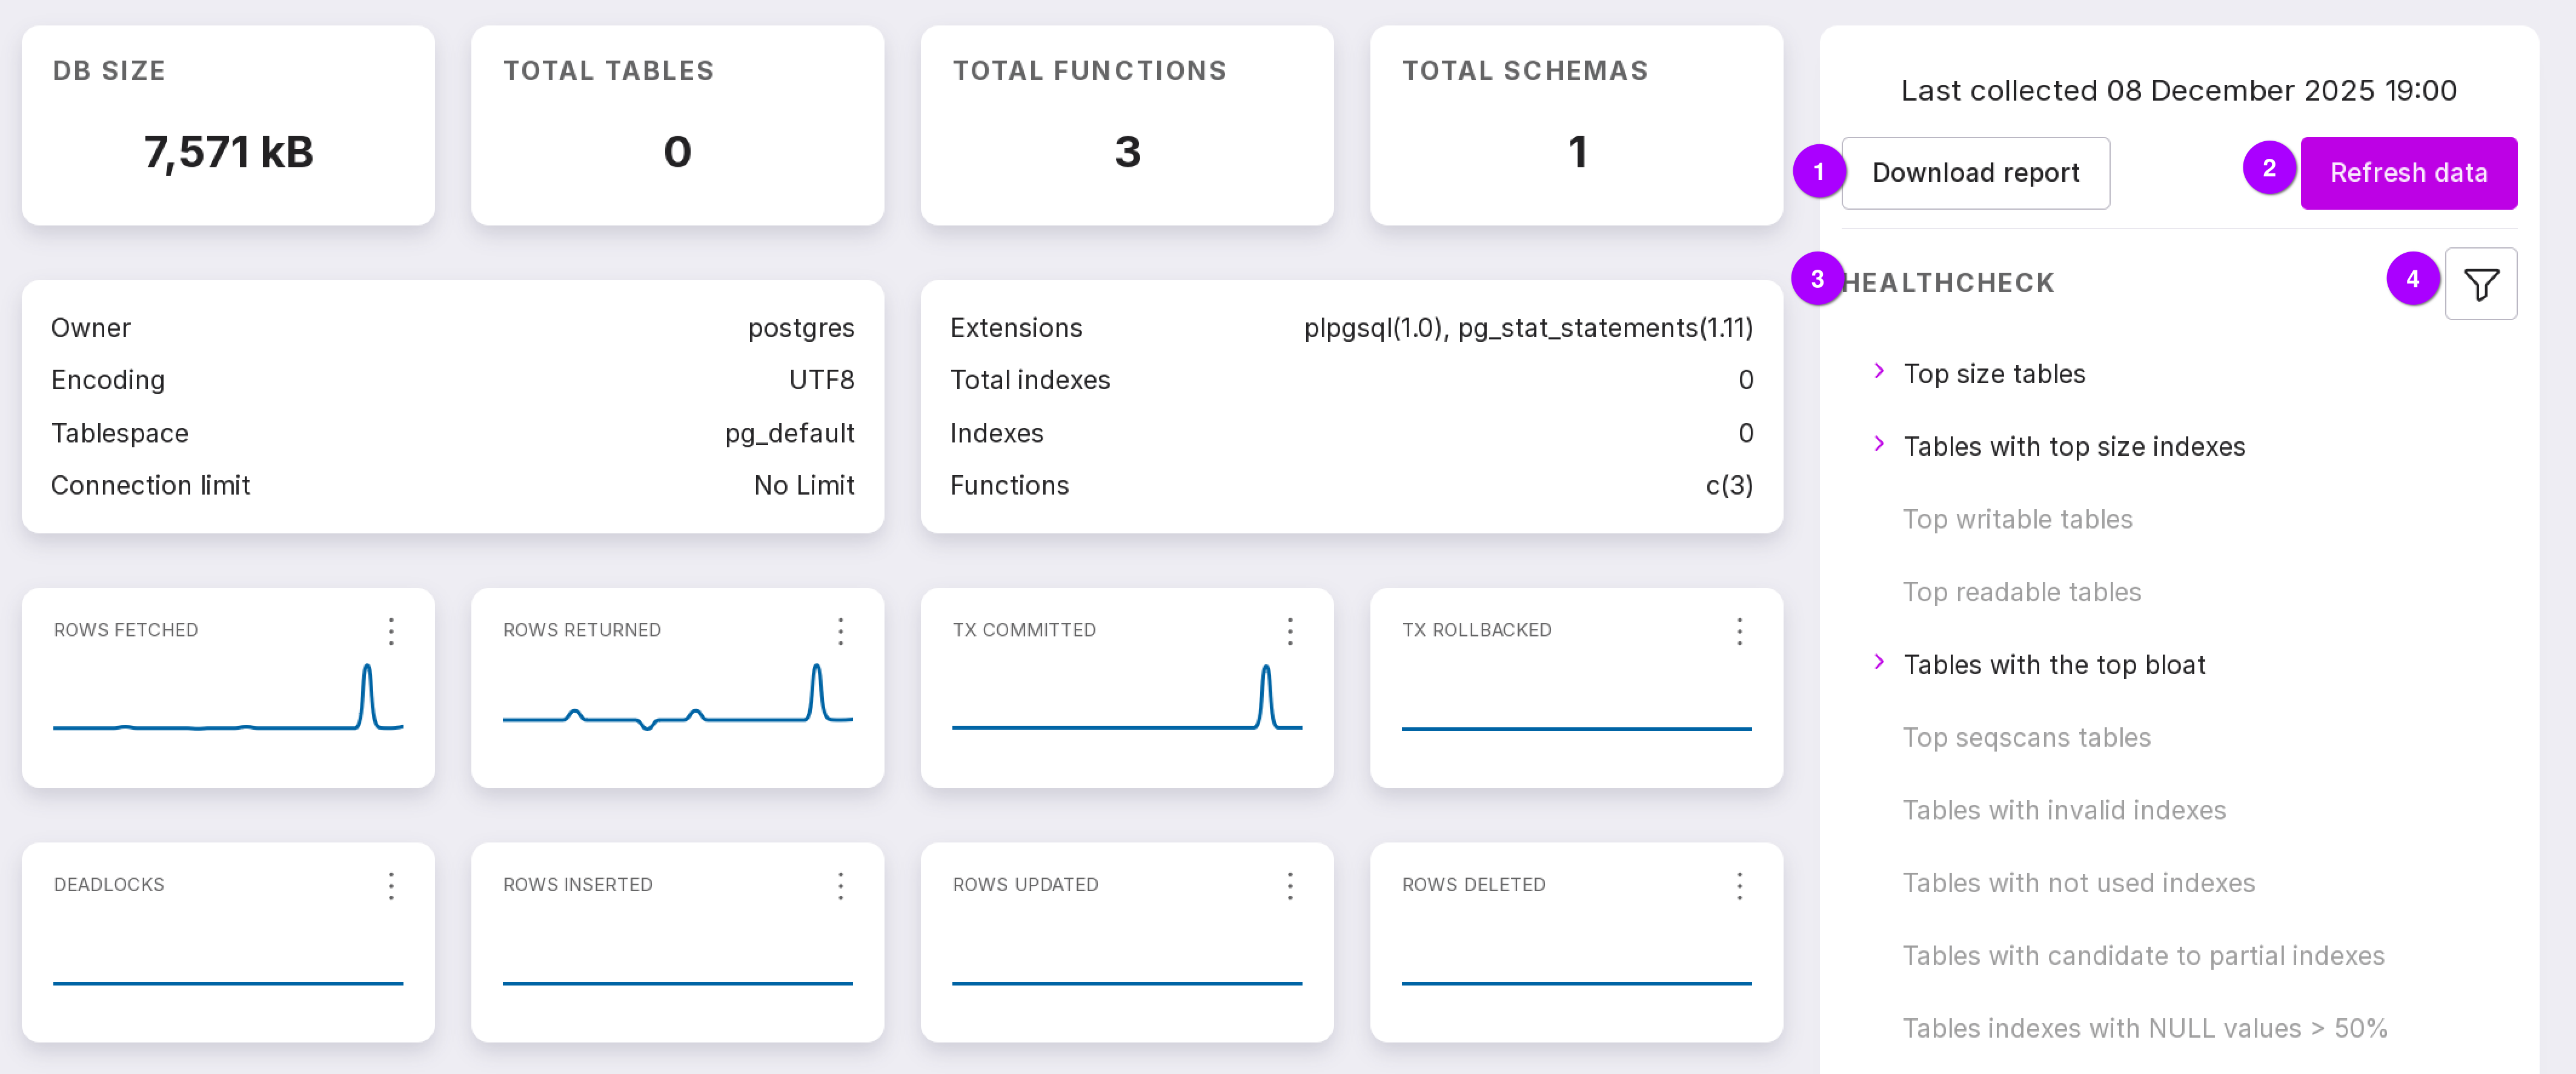
To refresh the collected data, click “Refresh Data” (number 2 in the figure above). Information is cached within the user session with the timestamp of data collection.
The “Download Report” button allows you to download the audit report in pdf format. The report contains basic information on the database, a complete analysis of the tables, and also identifies all the problems and provides recommendations for solving them.
Reports are generated using the 20 most problematic tables. If there are more tables in the database, the report for each issue will only list the 20 most relevant tables.
Currently, the following list of checks (HEALTHCHECKS) is supported:
Top size tables
Tables with top size indexes
Top writable tables
Top readable tables
Tables with the top bloat
Top seqscans tables
Tables with invalid indexes
Tables with not used indexes
Tables with candidates to partial indexes
Tables indexes with NULL values > 50%
Tables with redundant indexes
Tables with FKs without index
Tables with FKs with different data type then the original column
Tables with the low HOT updates ratio
Tables with possible autoanalyze issues
Tables with possible autovacuum issues
Tables without unique indexes
The maximum number of tables for a single check is 20.
If there are issues with the data schema or configuration settings in the database, the corresponding HEALTHCHECK will display a table. Then you can select the issue of interest in the ‘Healthcheck’ section (number 3 in the figure above). HEALTHCHECKS can be filtered by severity level (number 4 in the figure above).
Table map
The table map allows you to track their size and condition.
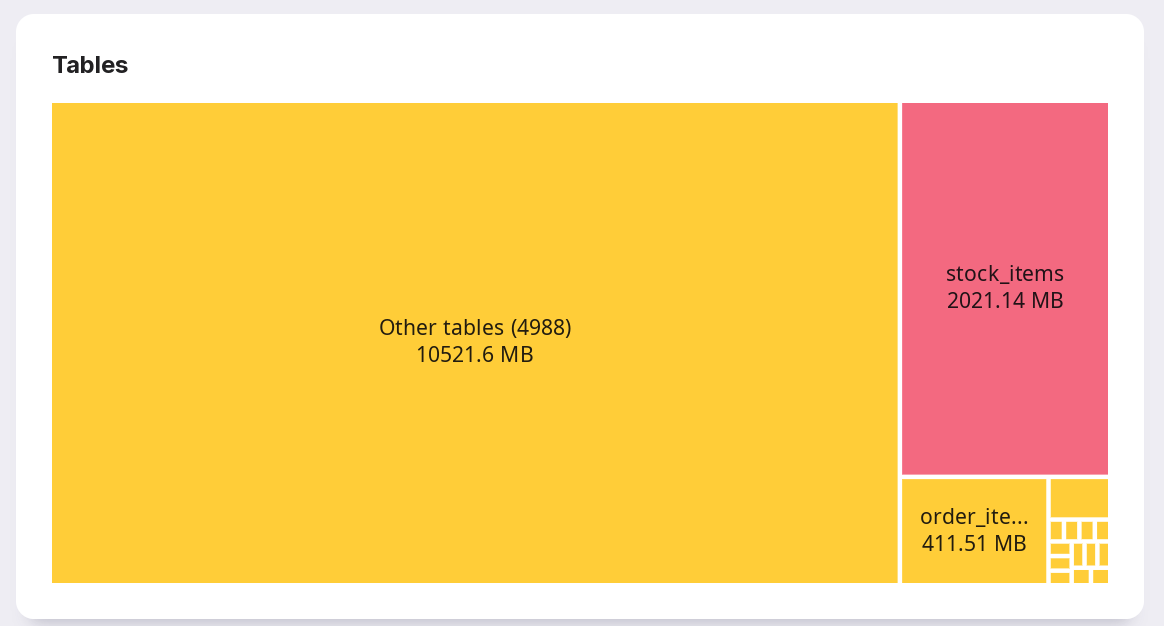
The 15 largest tables are shown in separate blocks. The block size depends on the size of the table. Very small tables may not appear on the map. Each table block will be colored depending on its condition:
green — no problems or warnings;
yellow — there are warnings;
red — there are problems.
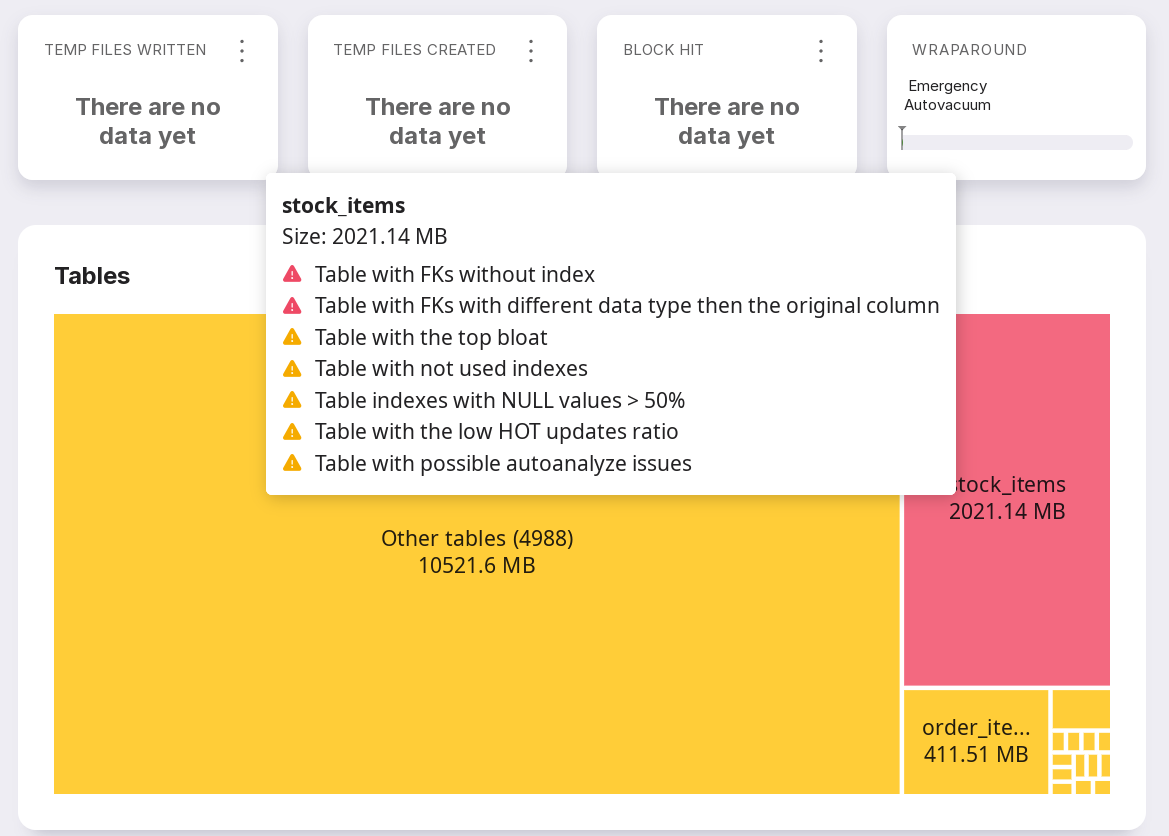
Click on a table block to view problems or warnings.
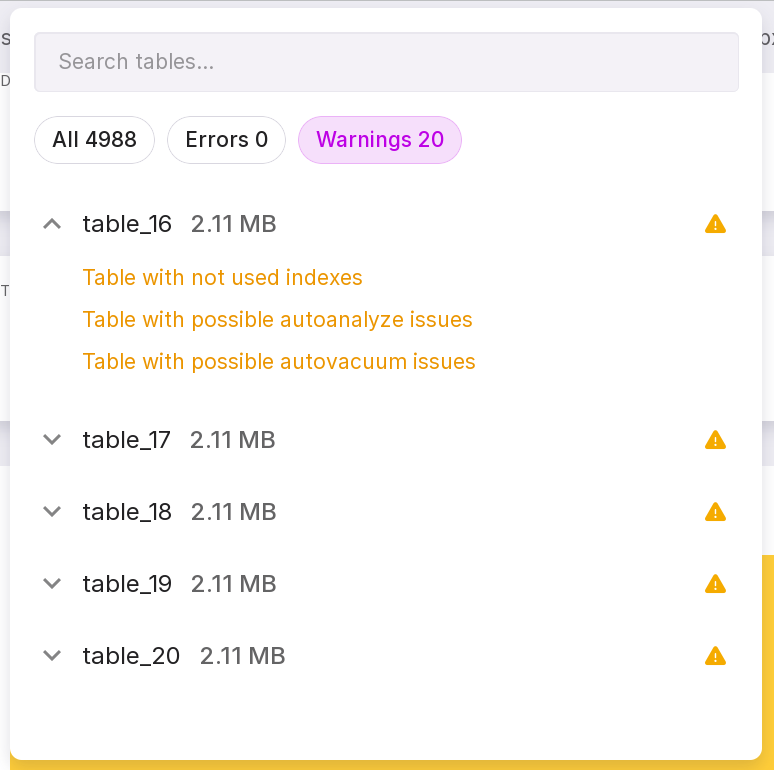
Tables not from the TOP-15 will be combined into the “Other tables” section. Click on the block to view more information. The window that opens shows:
a general list of tables with their sizes;
tables with problems;
tables with warnings.
In the search box, you can search for tables by name.
On the Problems and Warnings tabs, click the arrow next to the table name to open detailed information.
Overview tab
Each healthcheck can be expanded using the arrow to the left of the check and clicking on the file with the results of its execution (number 1 in the image below):
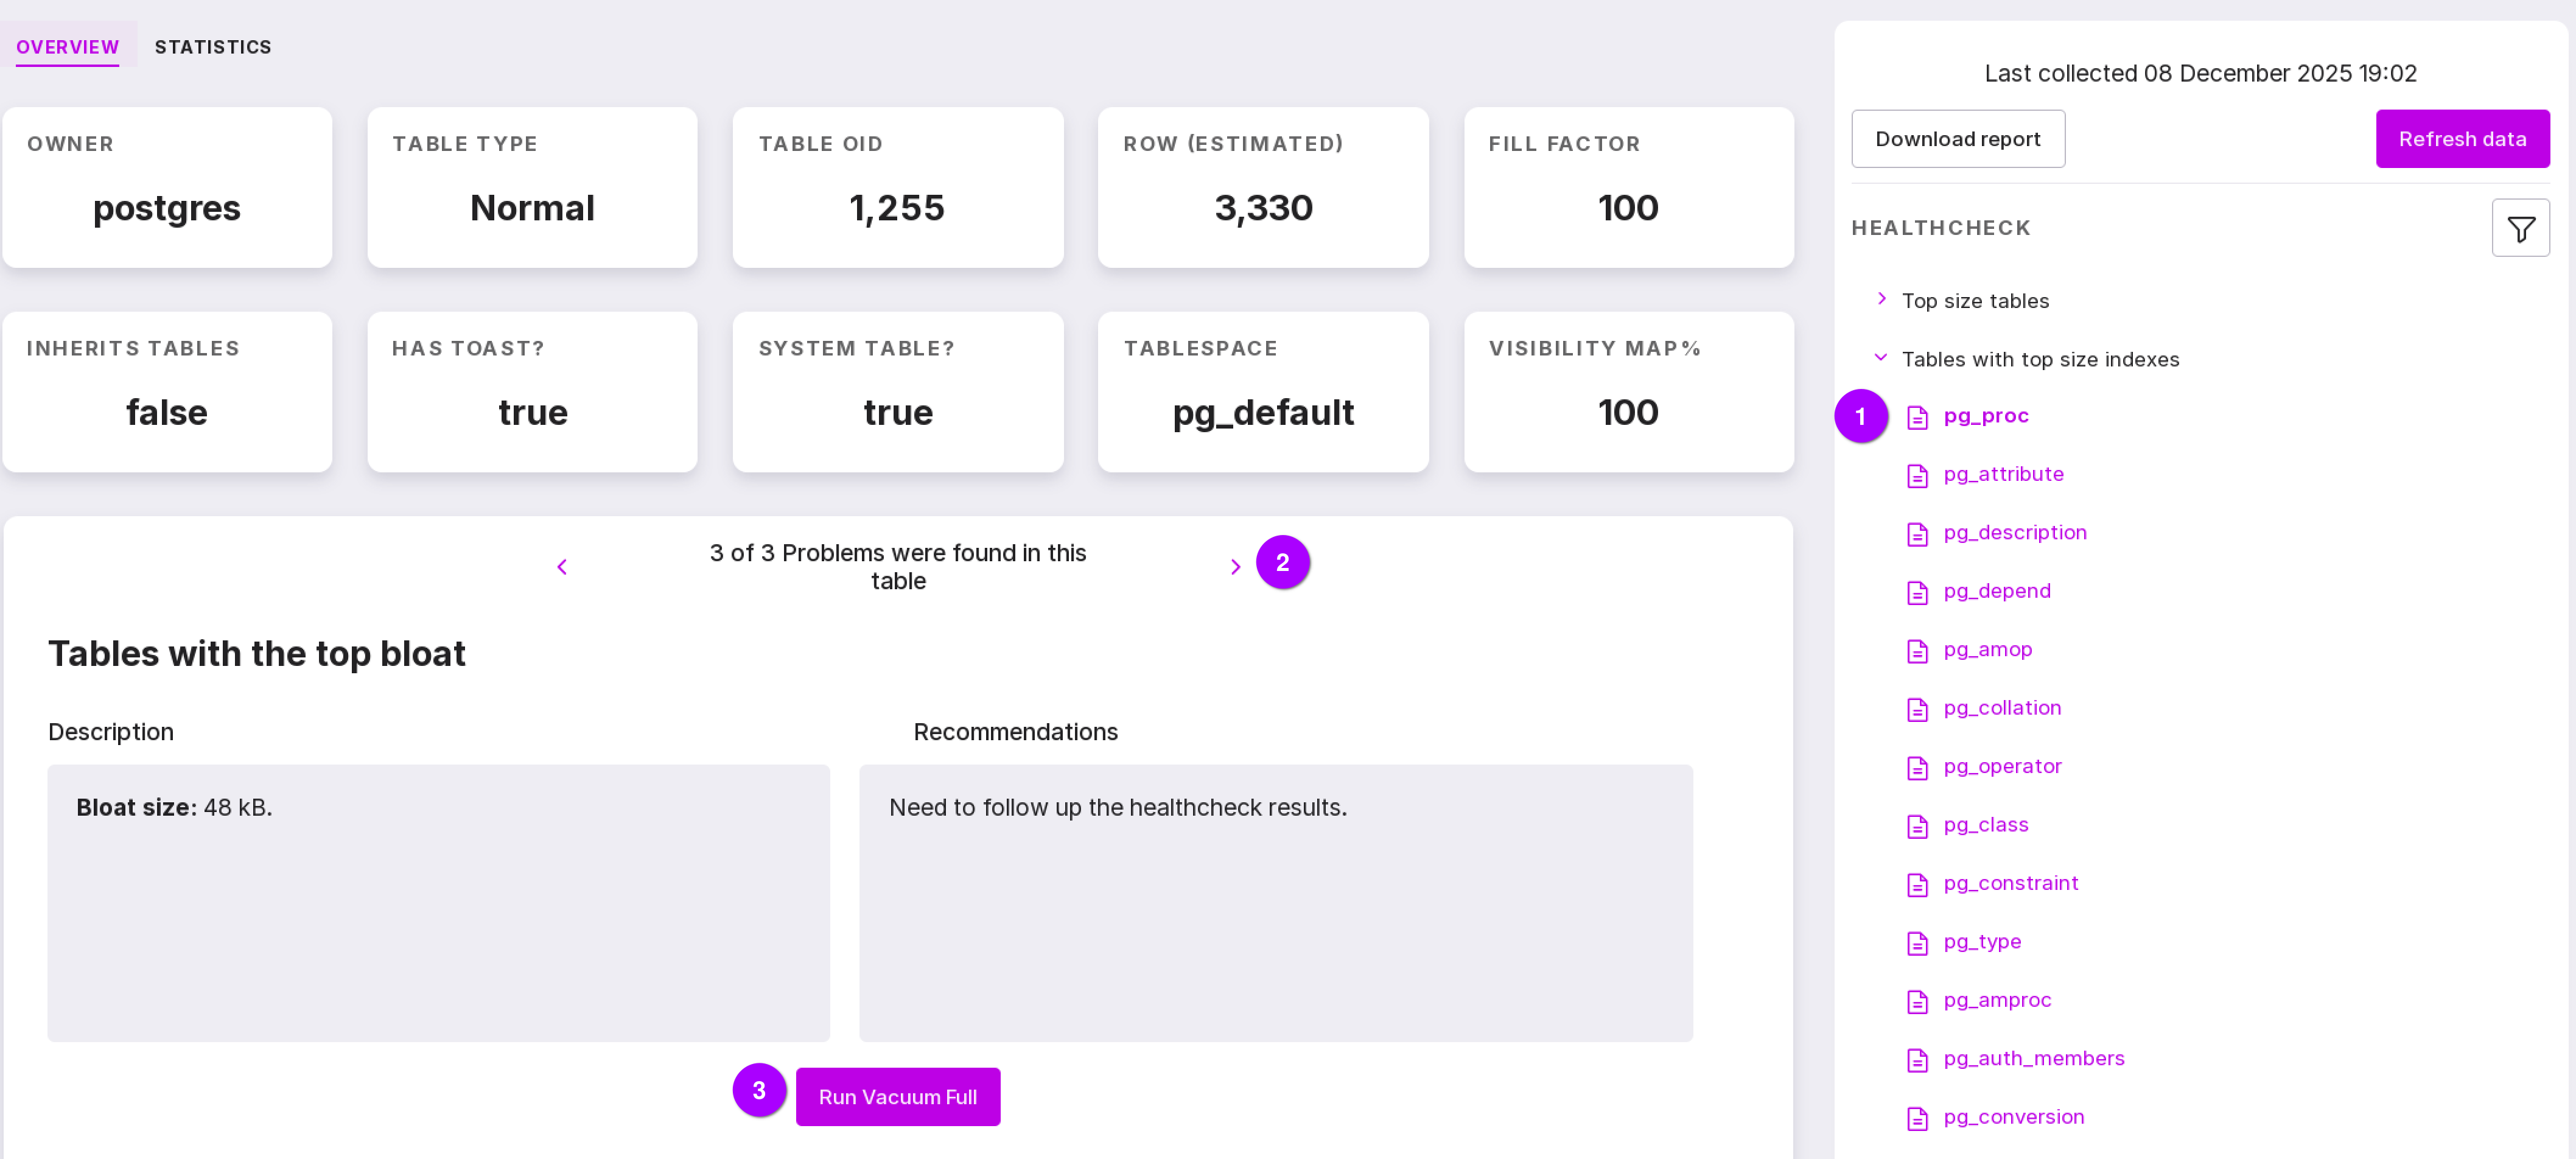
The screen will display information with a description of the problem and recommendations for fixing it. You can navigate between several problems related to the same object (number 2 in the figure above).
Some issues can be resolved using Platform tools. In this case, there will be a corresponding button in the description section (number 3 in the figure above).
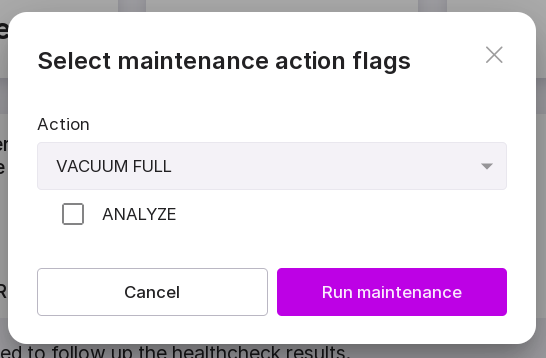
To start, click the “Run Maintenance” button in the opened modal window.
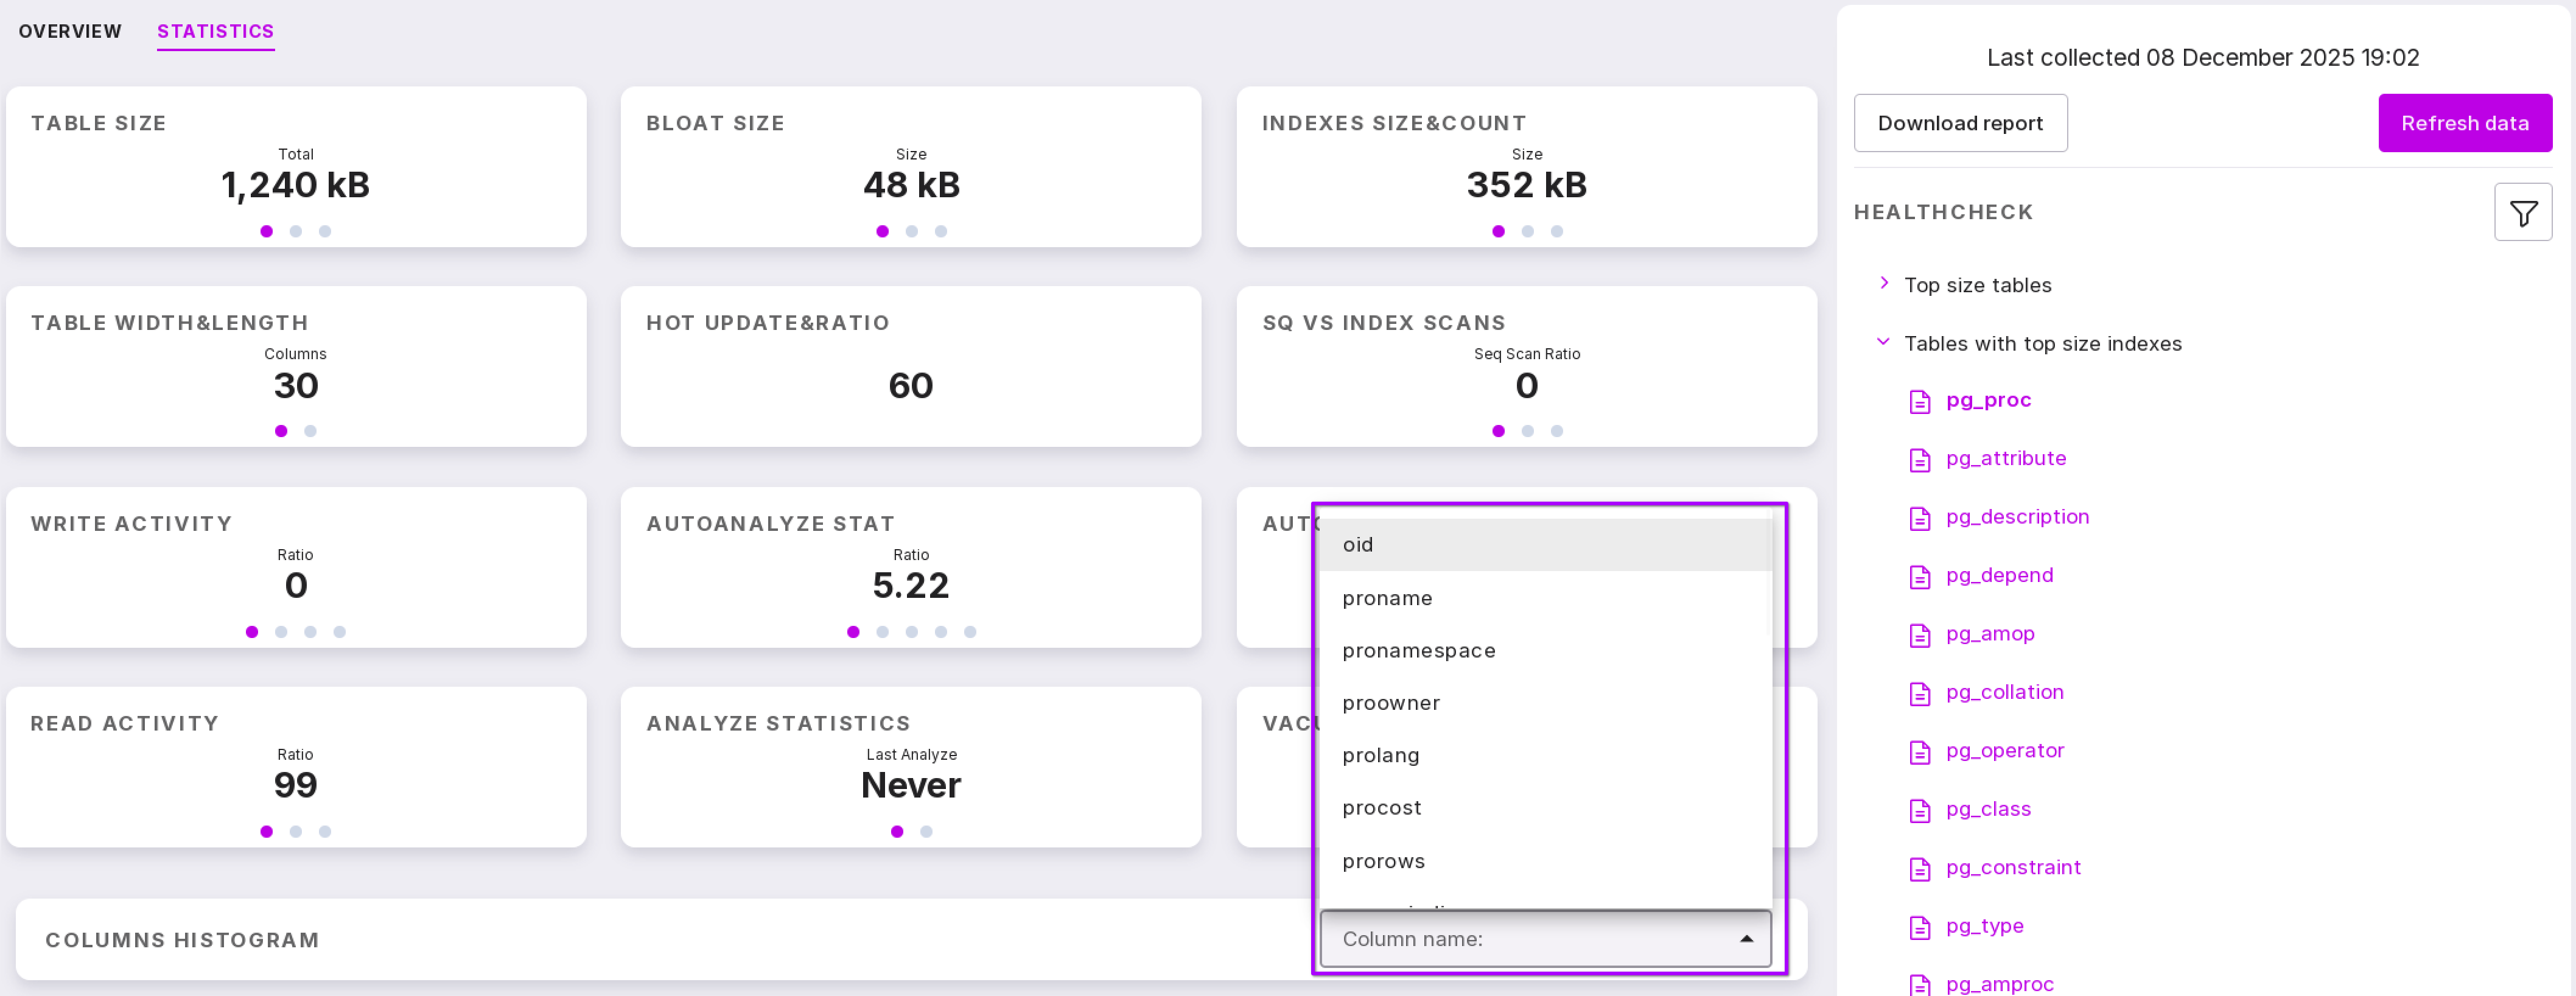
Statistics tab
The page shows detailed statistics on working with the table, maintenance statistics, as well as the distribution of values from the last analysis. To view the histogram, select the column of interest from the database:
Connecting to the database
To open the DB Browser panel, you need to connect to the DB. To connect to the DB:
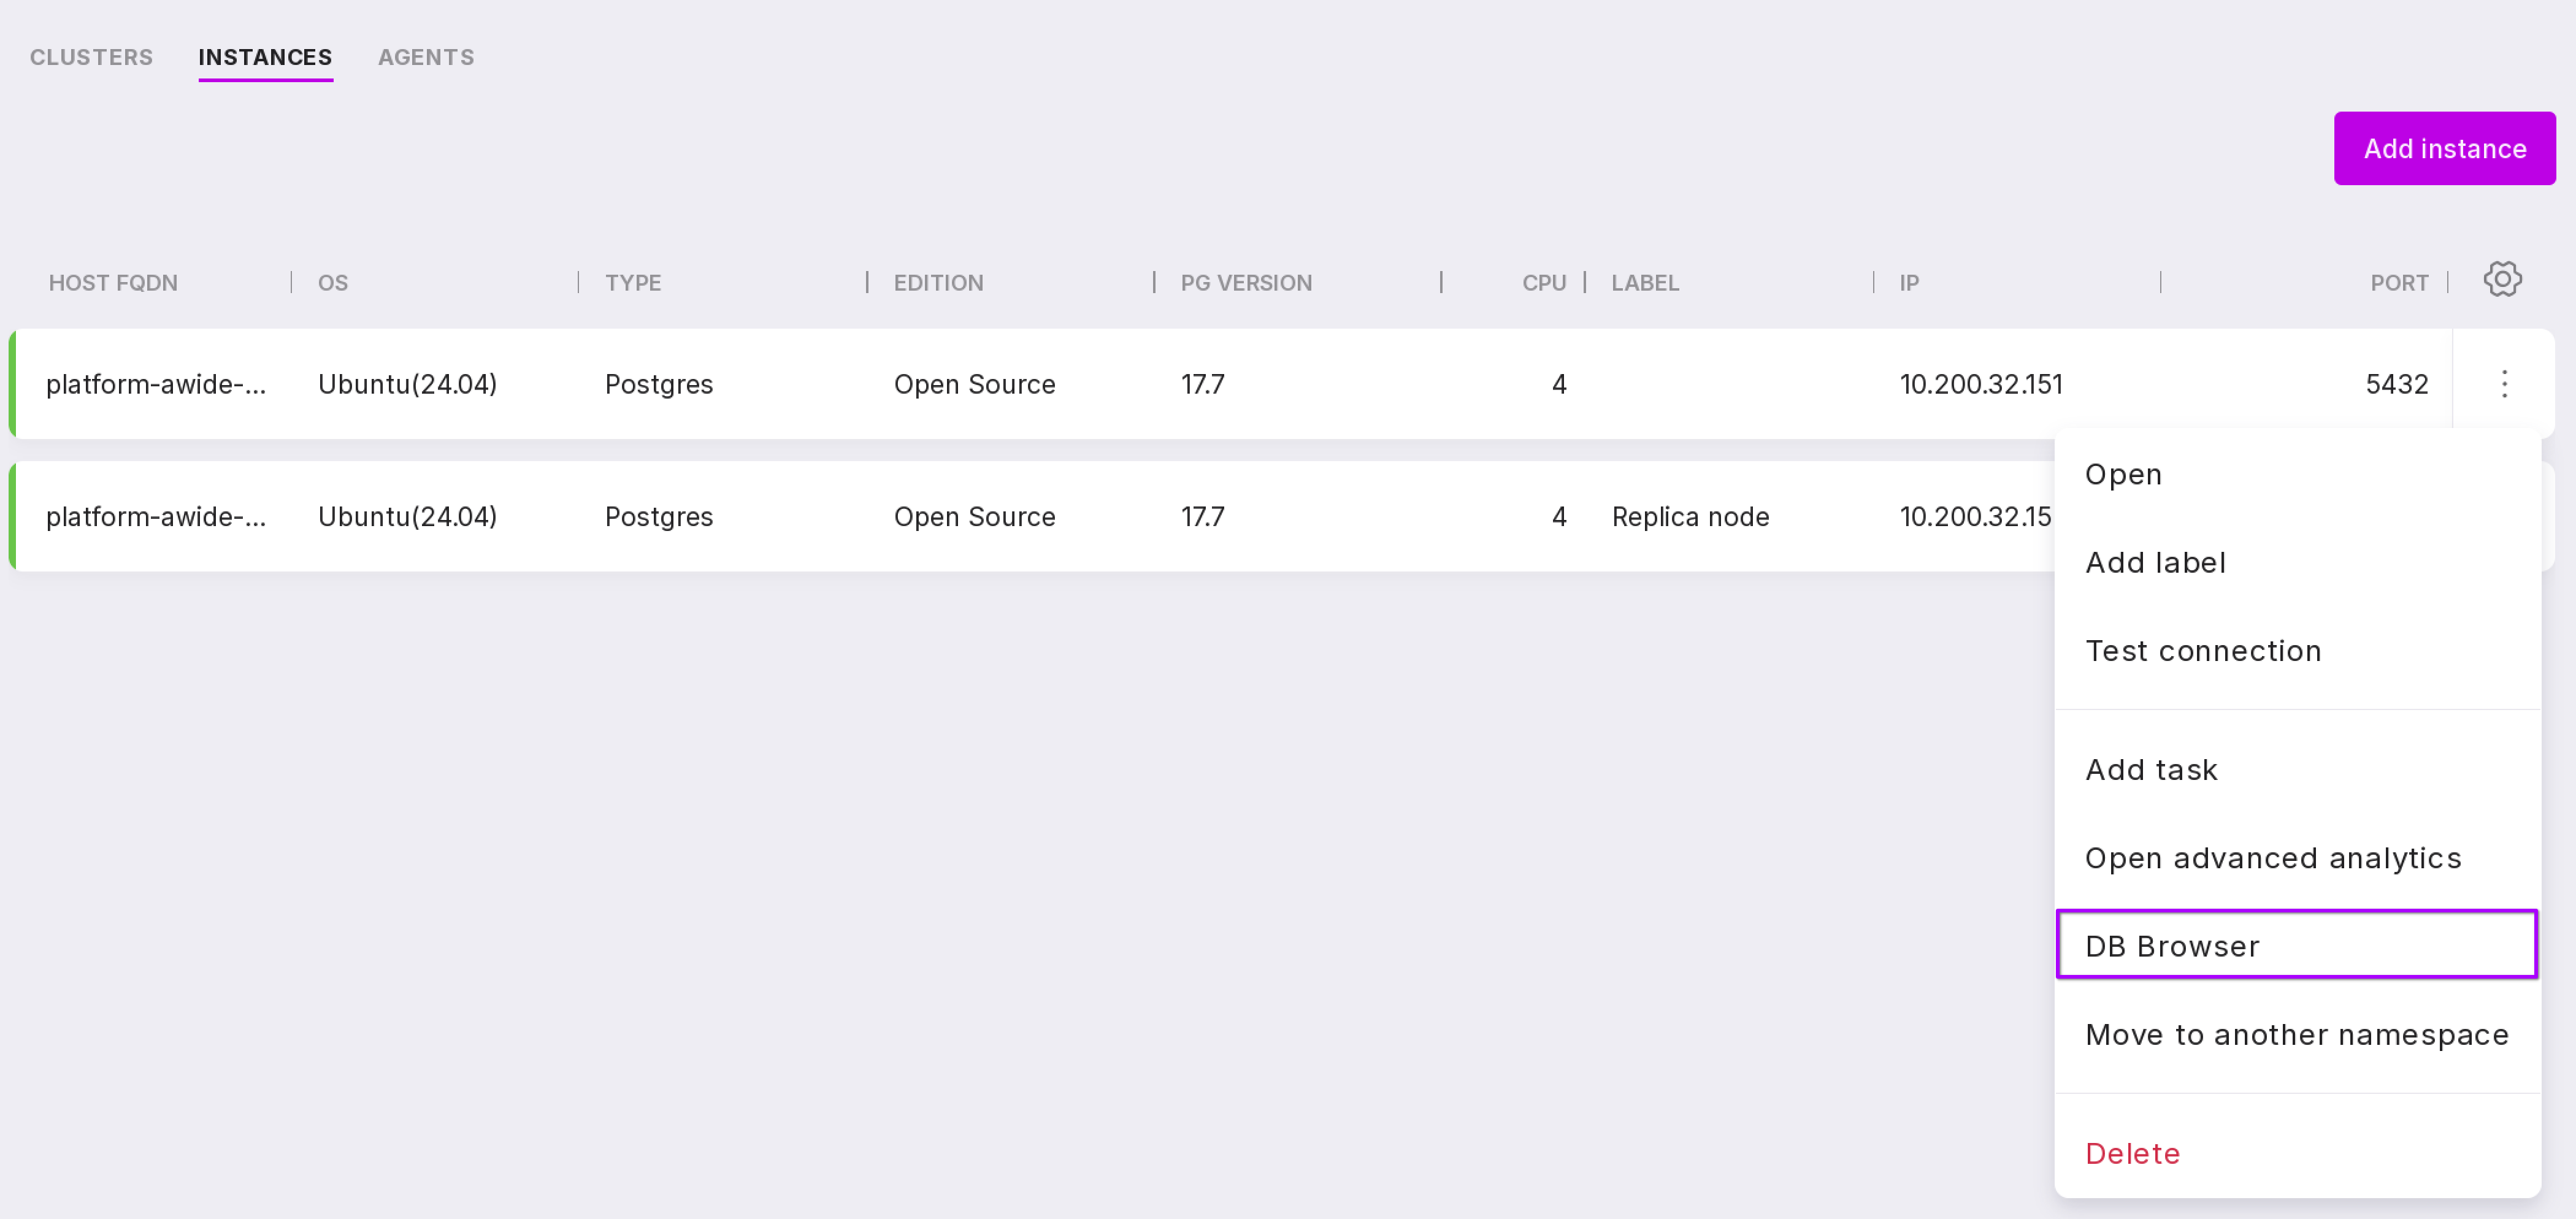
Open the connection window. Thre are several ways to connect to databases:
Click on the “DB Browser” item in the instance menu on the page with the list of instances within the namespace or at the namespace level within the tenant.
Click on the ‘SQL Editor’ button on the DB Browser page.
Click “Data Schema” on the DB Browser page.
In the modal window for connecting to the database, fill in the following fields:
In the dropdown list, select the name of the DB to connect to. When connecting from the DB Browser page, this field will be pre-filled with the name of the DB in the row where you clicked the “SQL Editor” or “Data Schema” button.
Type in DB user login.
Type in user password.

Note
The entered data is not stored on the server, so it will need to be re-entered for each new connection to the database.
After filling in the fields, click “Connect”.
When connecting to the DB using 1st or 2nd method, the DB Browser panel will open in the SQL editor.
When connecting to the DB using the third method, the DB Browser panel will open without the SQL editor.
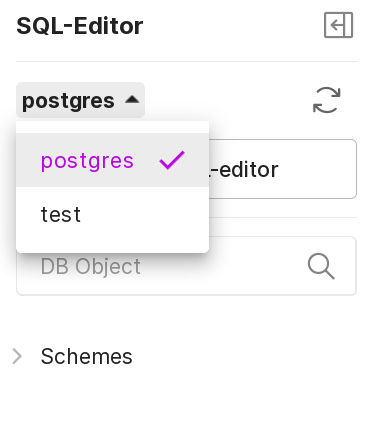
From this page, you can reconnect to another DB. To do this, select its name from the dropdown list and fill in the fields described above in the modal window for connecting to the DB.
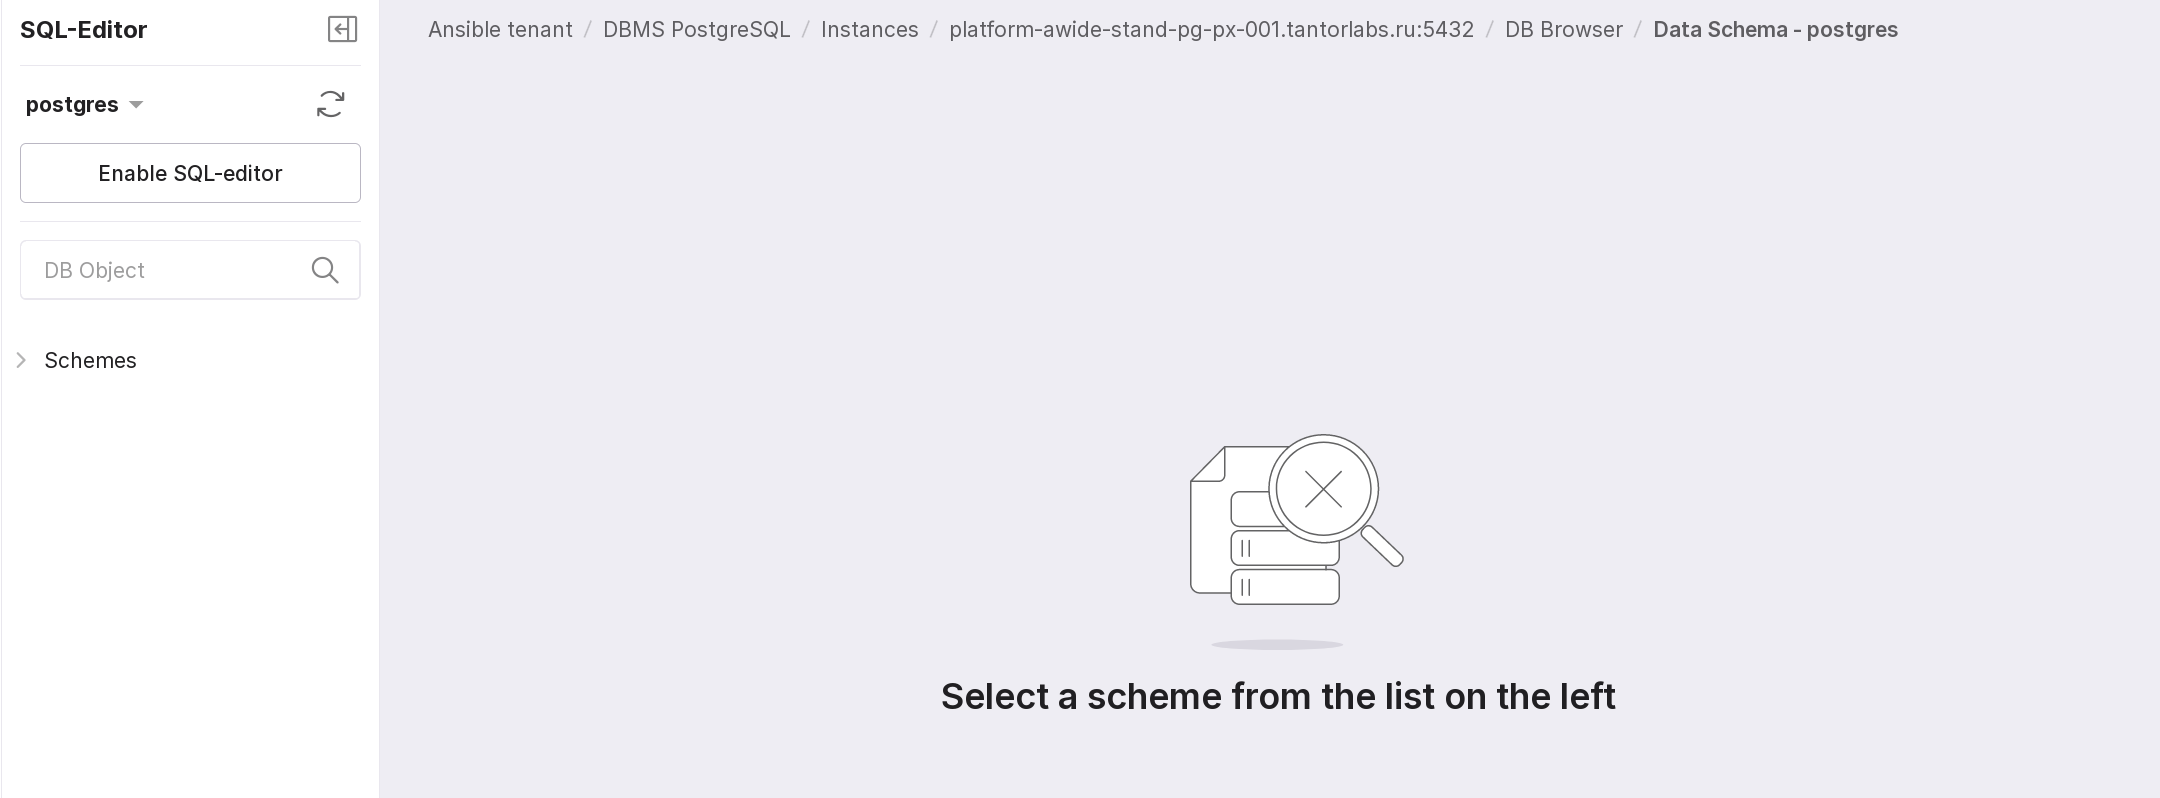
DB Browser Panel
On the left side of the DB Browser panel, the schema of the database to which the user is connected is displayed.
To expand the schema and all elements, click the arrow to the left of them:
The “Tables” section displays a list of table names contained in this DB.
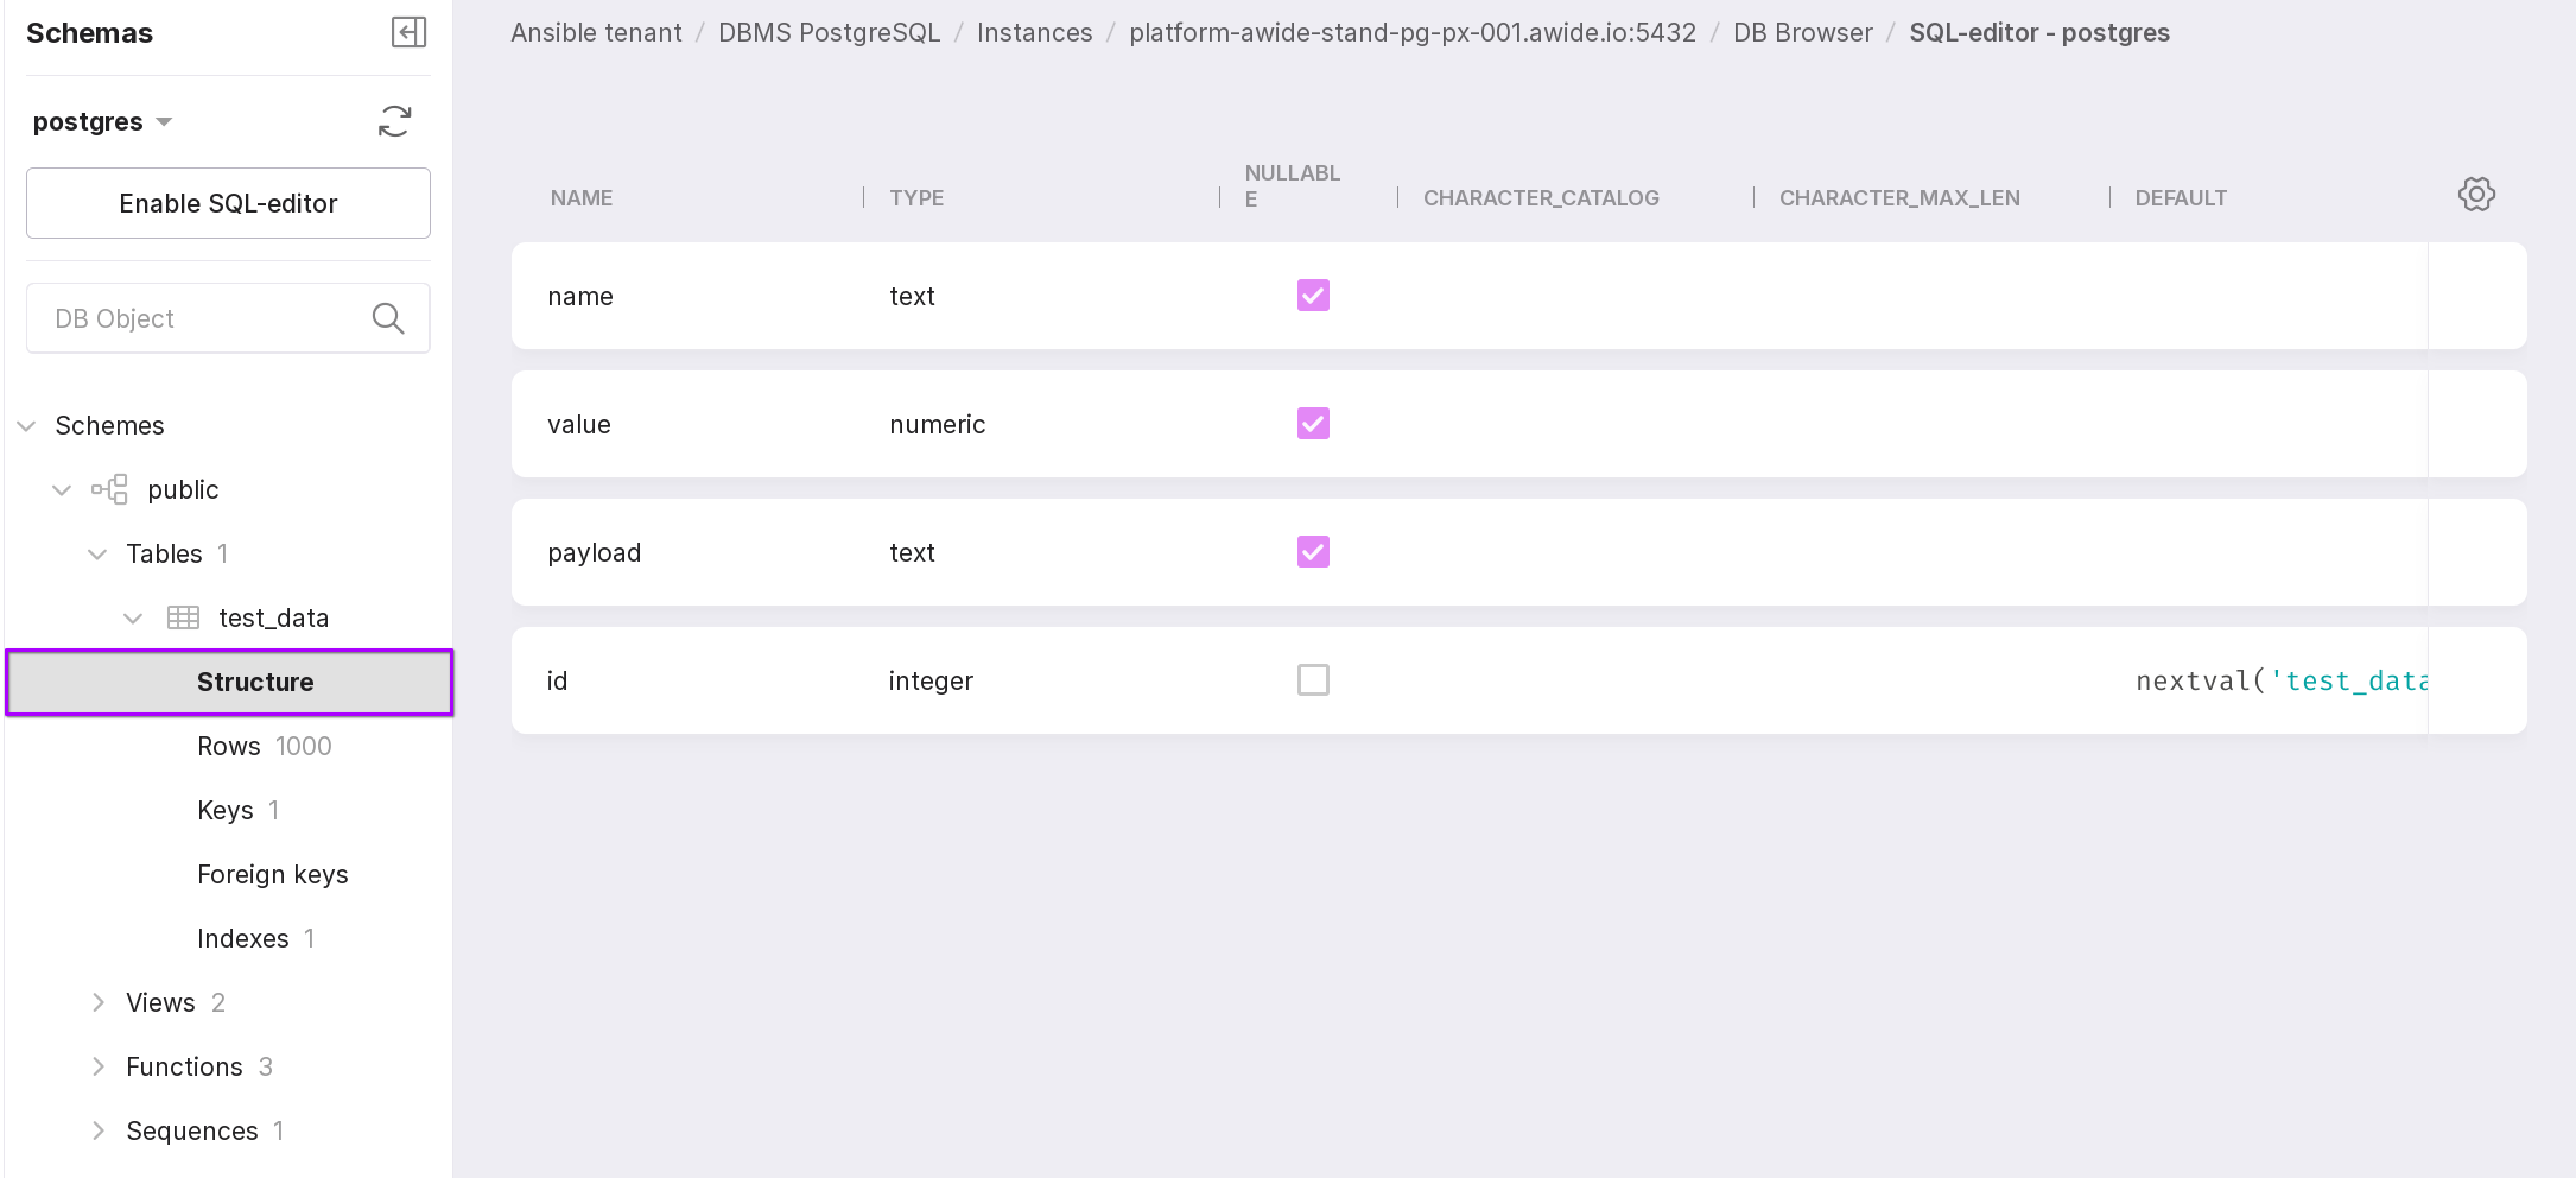
The “Structure” section displays the structure of the table — a list of all its columns and their detailed description:
column name;
column type;
information on whether this column can have values equal to NULL;
a set of characters that can have values for this column;
the maximum length of the value for this column;
the default value;
a comment for the column.
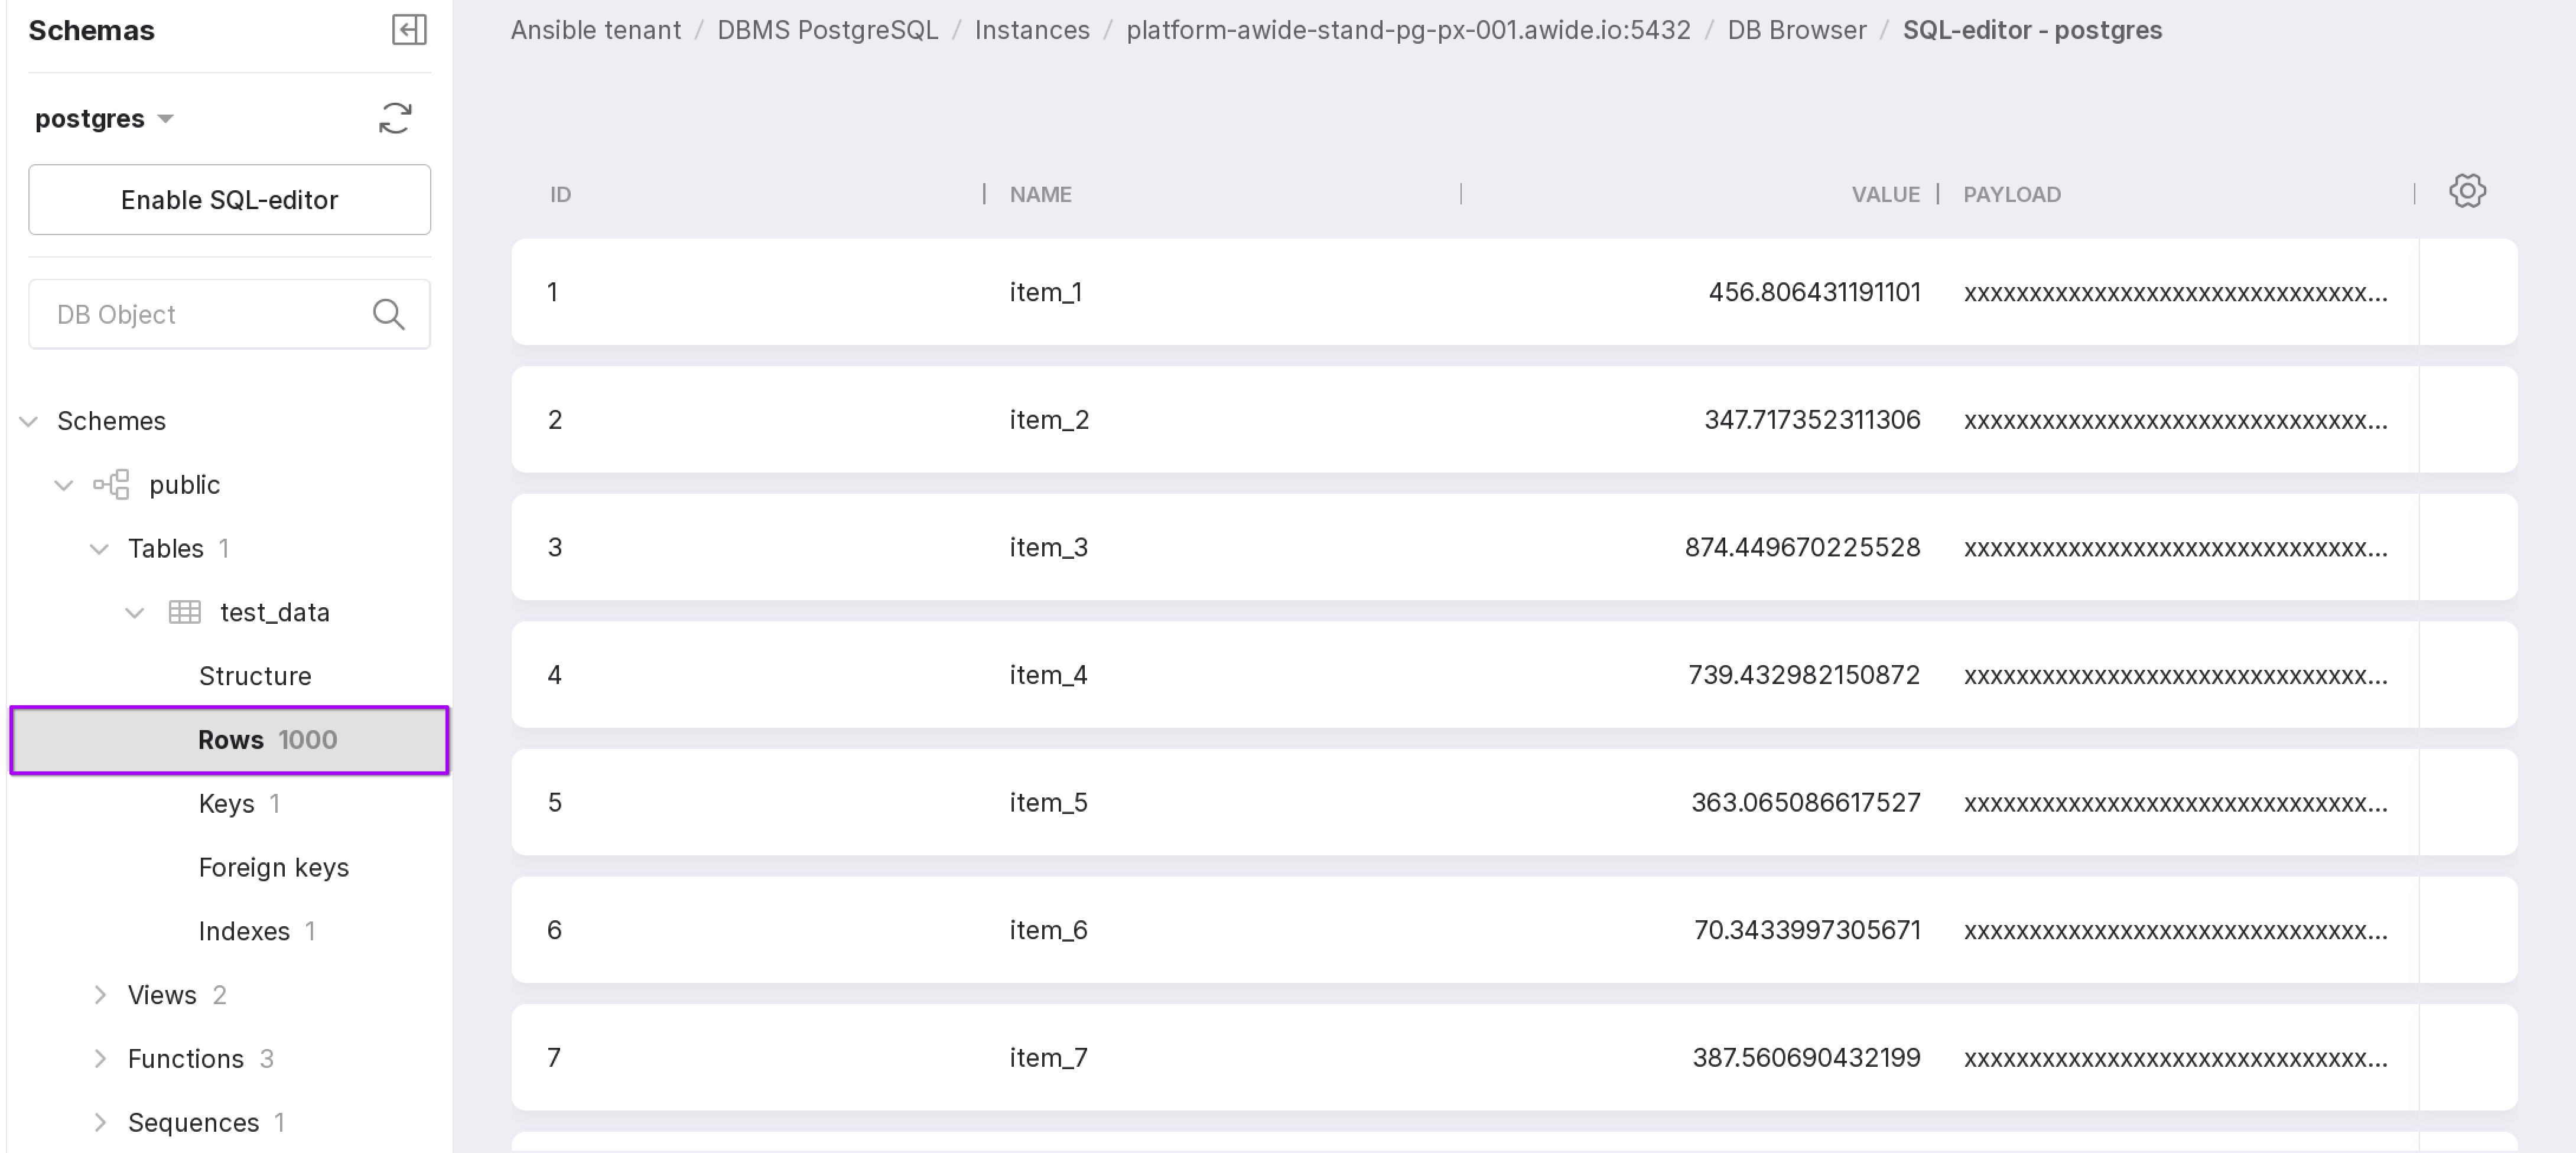
The “Rows” section displays the entire contents of the table.
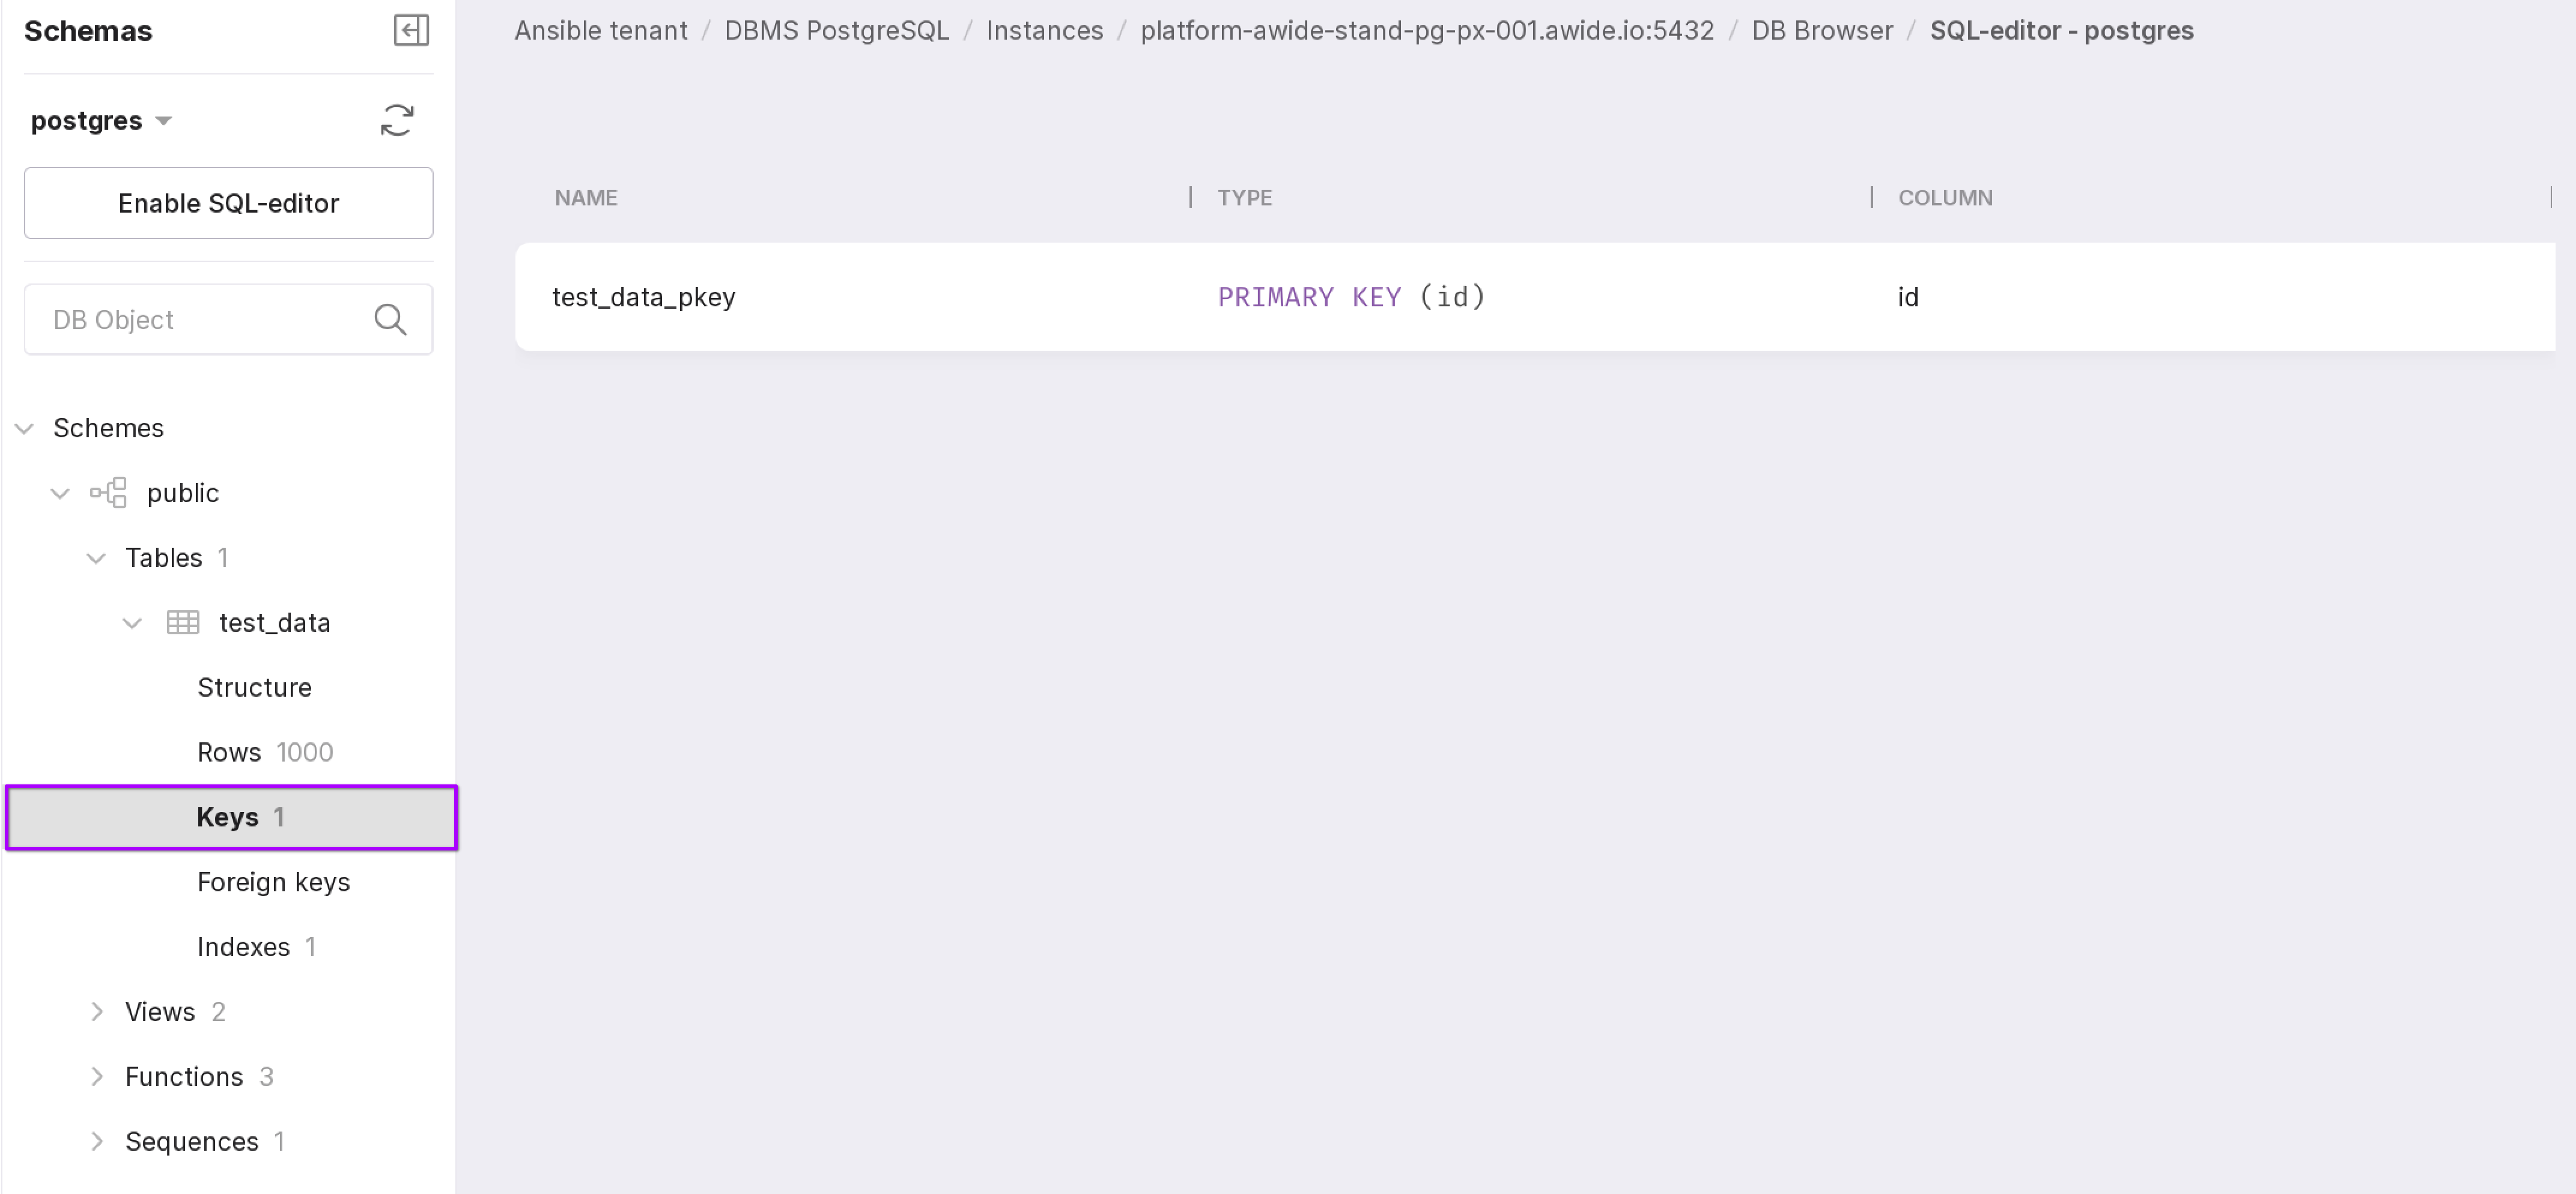
The “Keys” section displays a list of primary keys and information on them:
the name of the primary key of the table,
the type of the primary key,
the name of the table column that serves as the primary key.
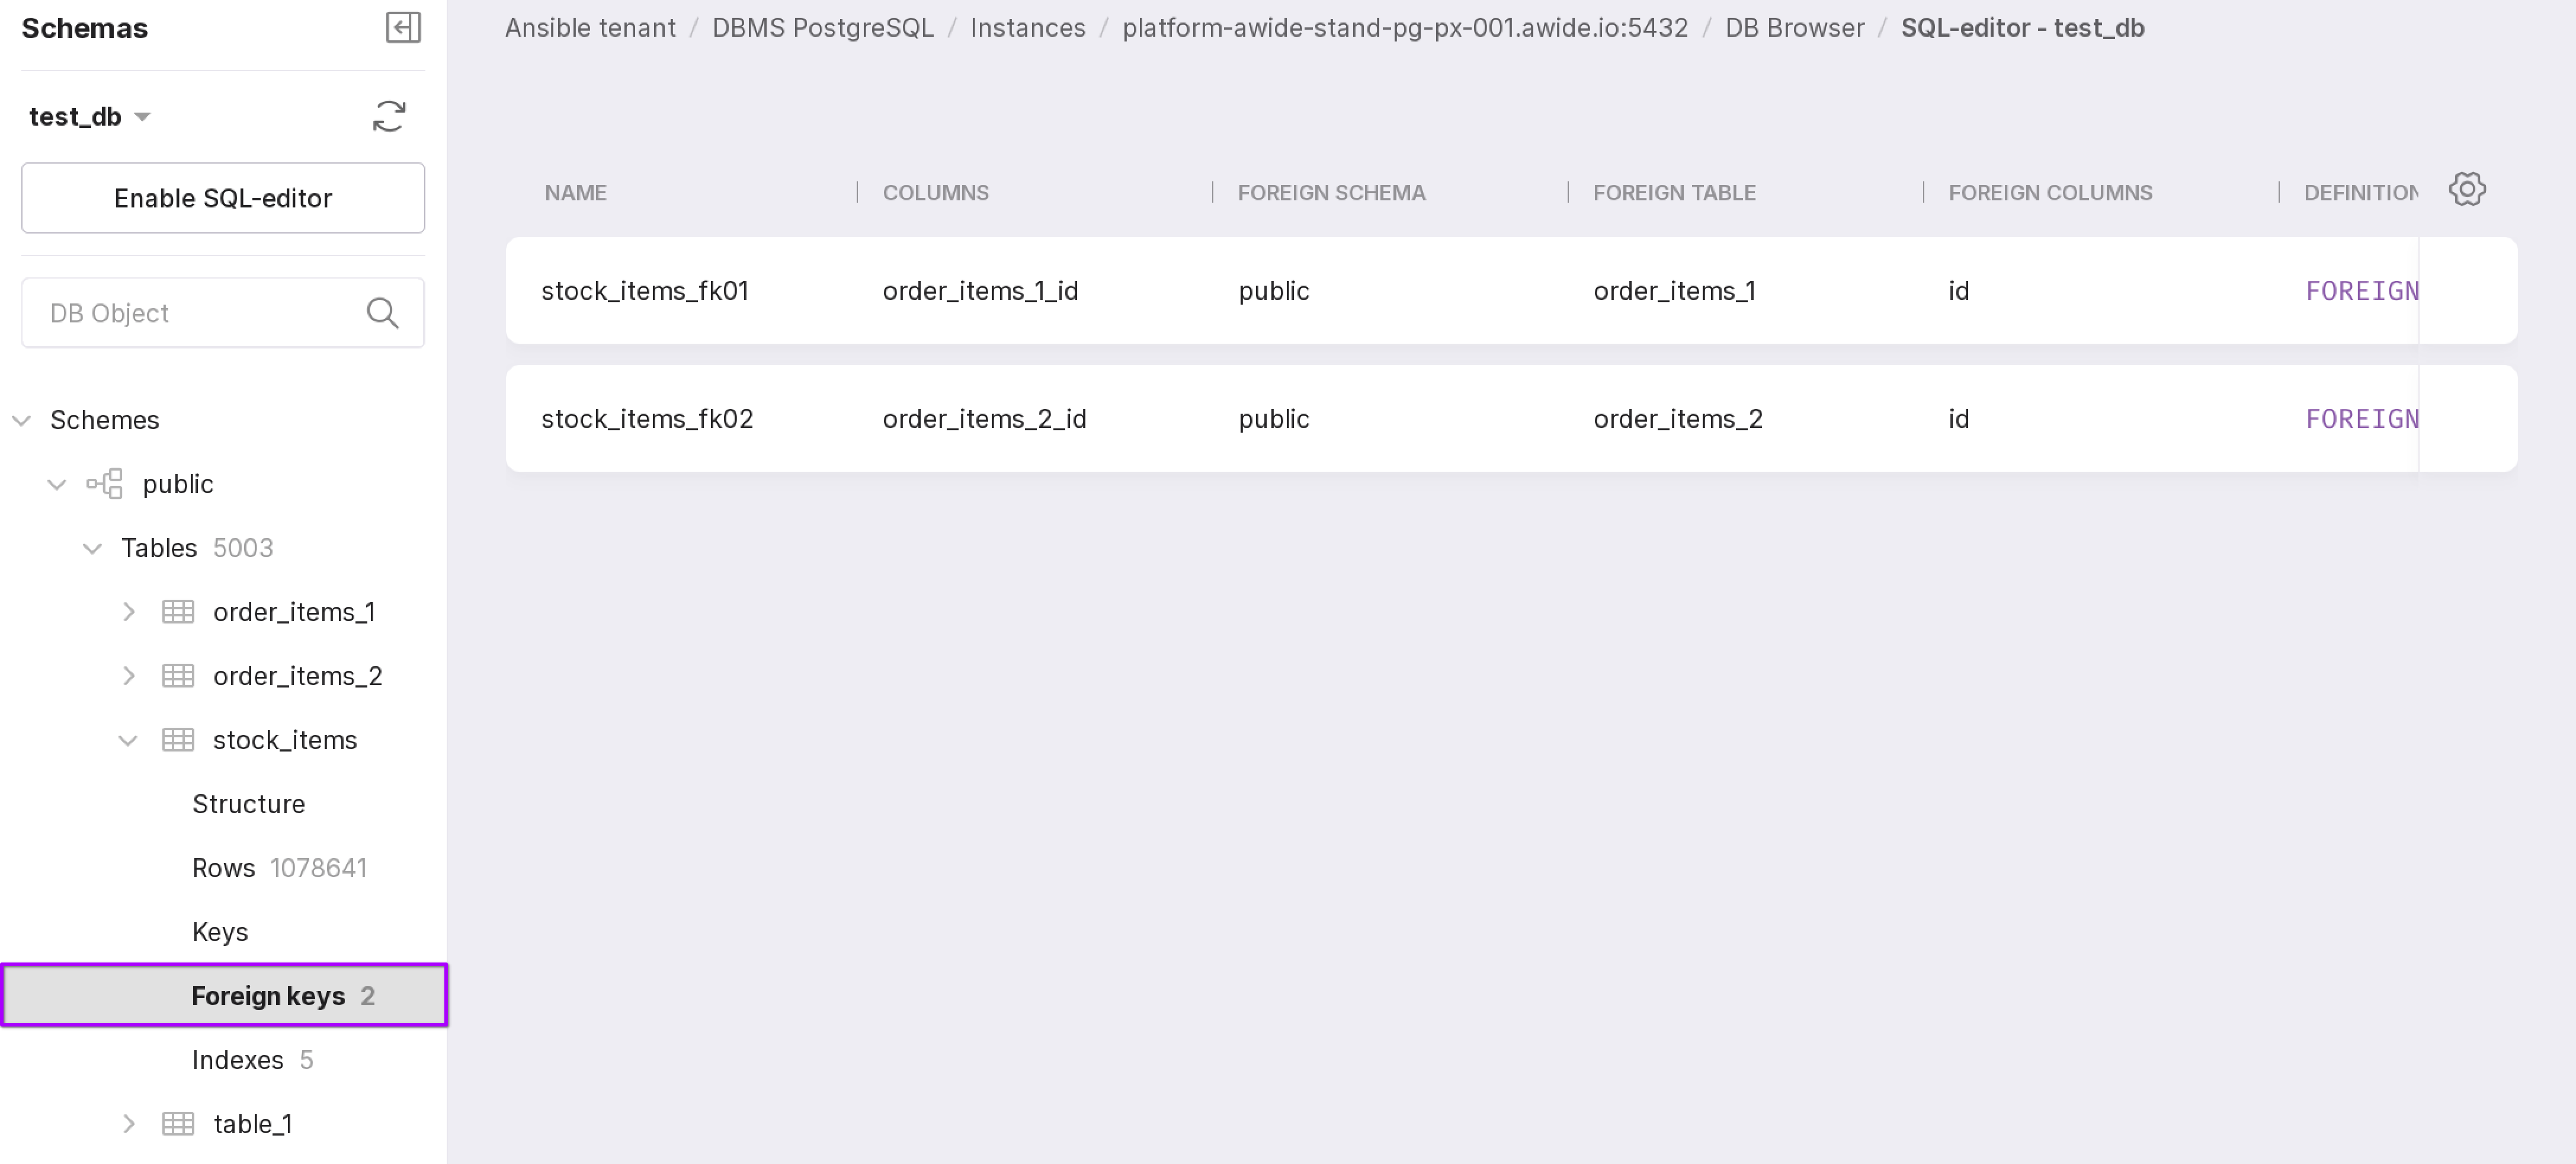
The “Foreign keys” section displays a list of secondary (or foreign) keys and information on them:
the name of the secondary key;
the name of the column that serves as the secondary key;
the name of the schema containing this key;
the name of the table containing this key;
the name of the primary key that this secondary key references;
definition of this secondary key.
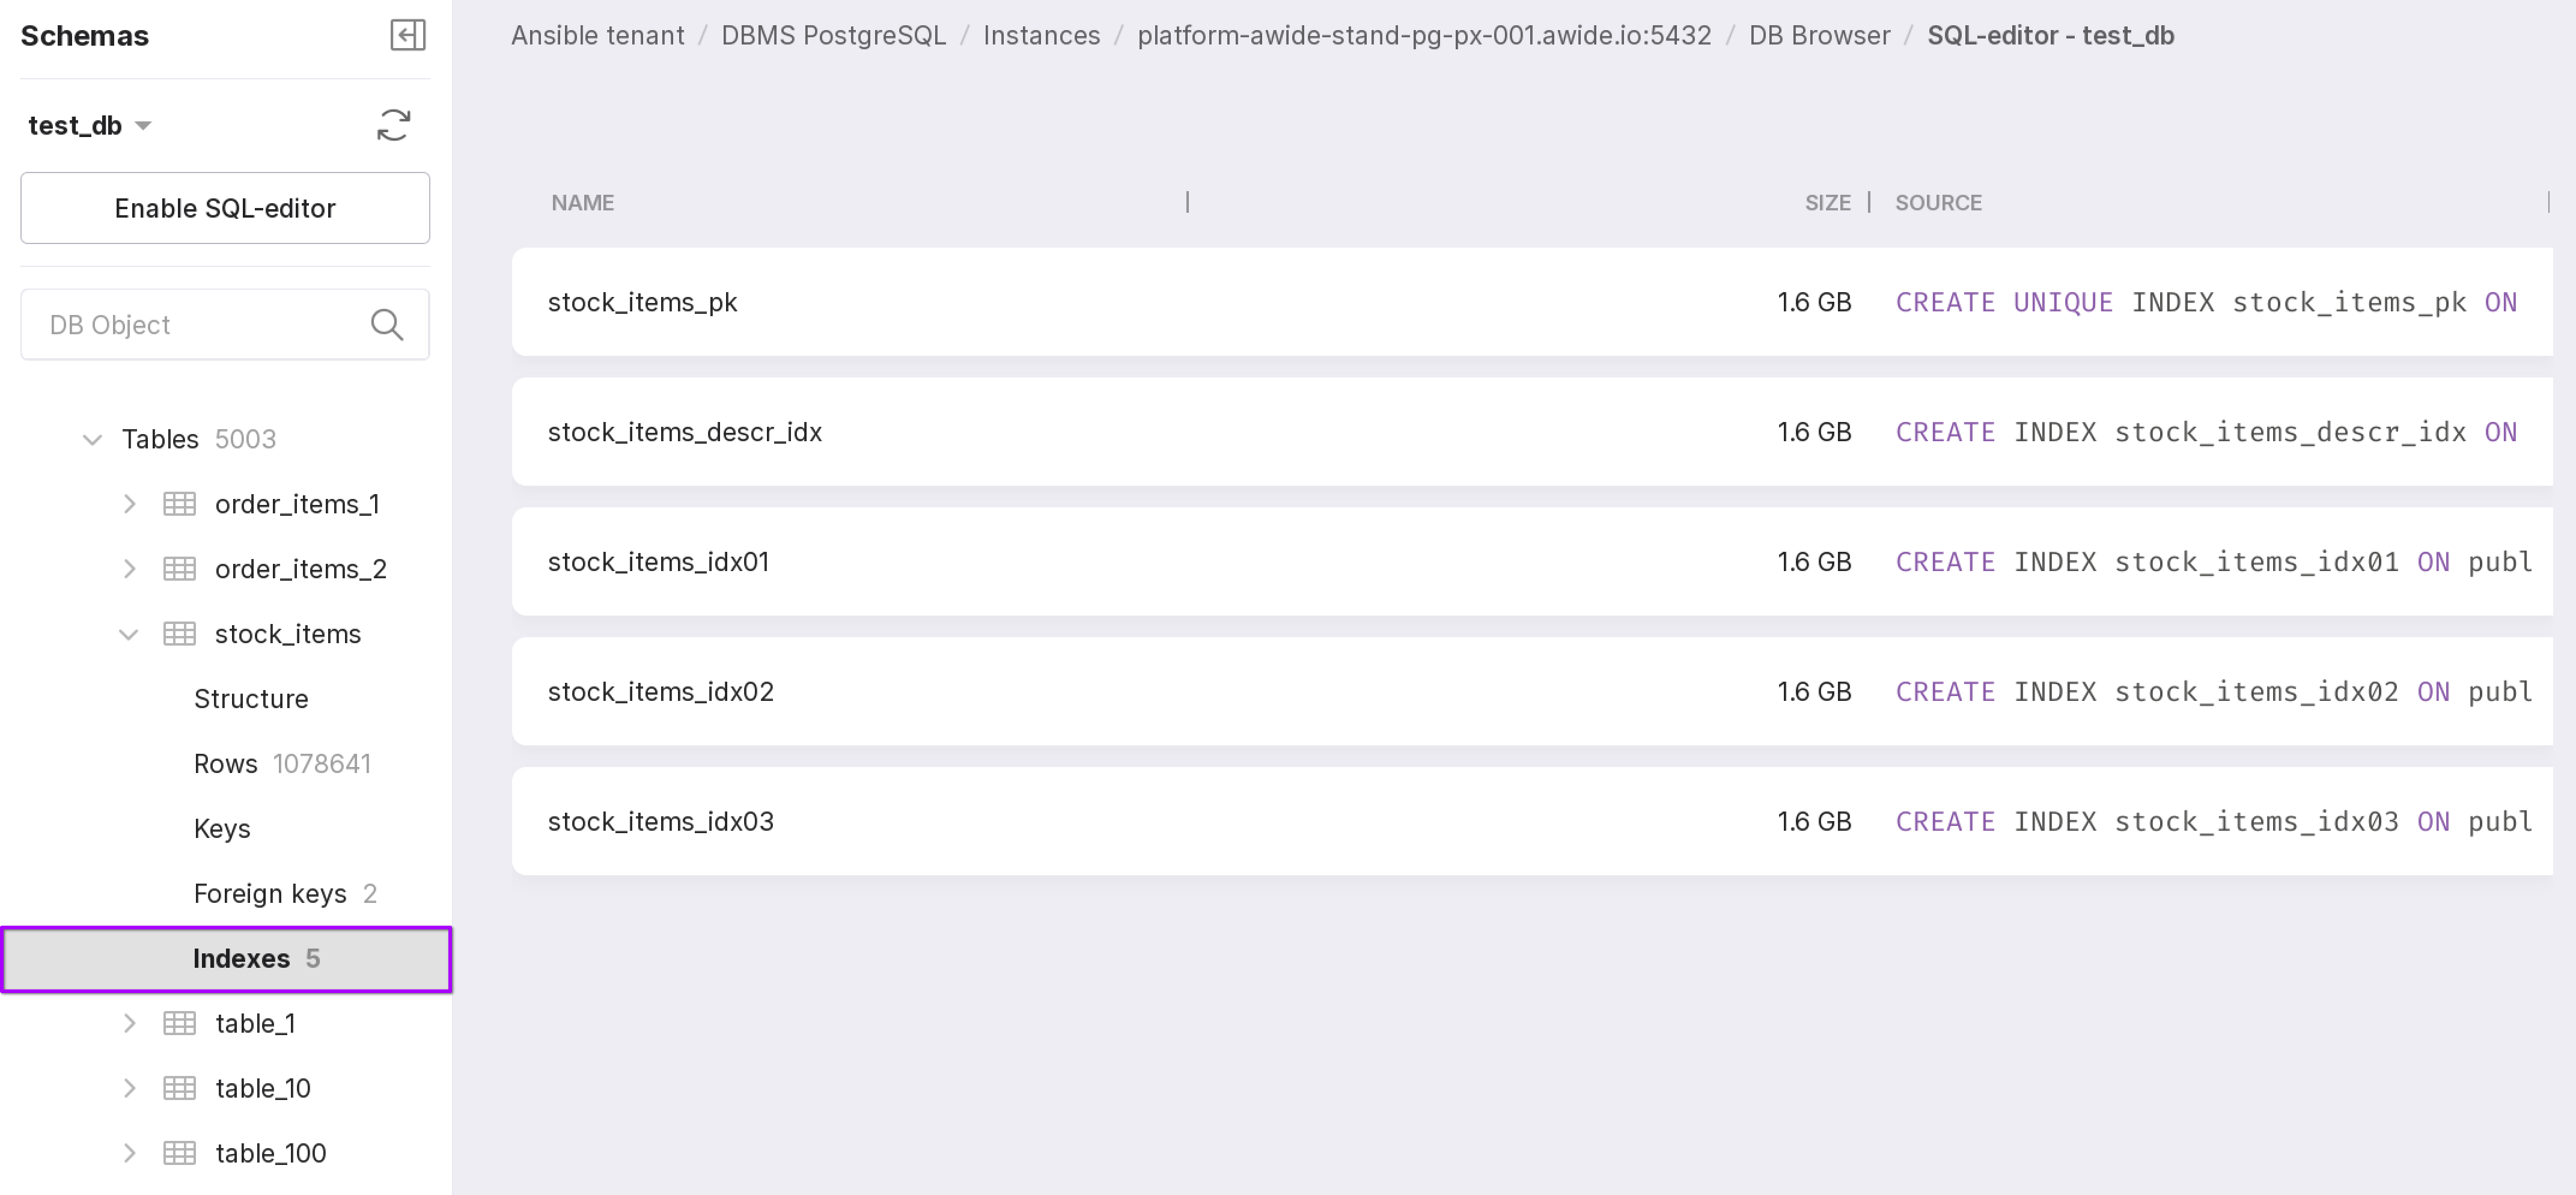
The “indexes” section displays a list of all indexes of the table and information on them:
the name of the index,
the size of the index,
the source of the index creation.
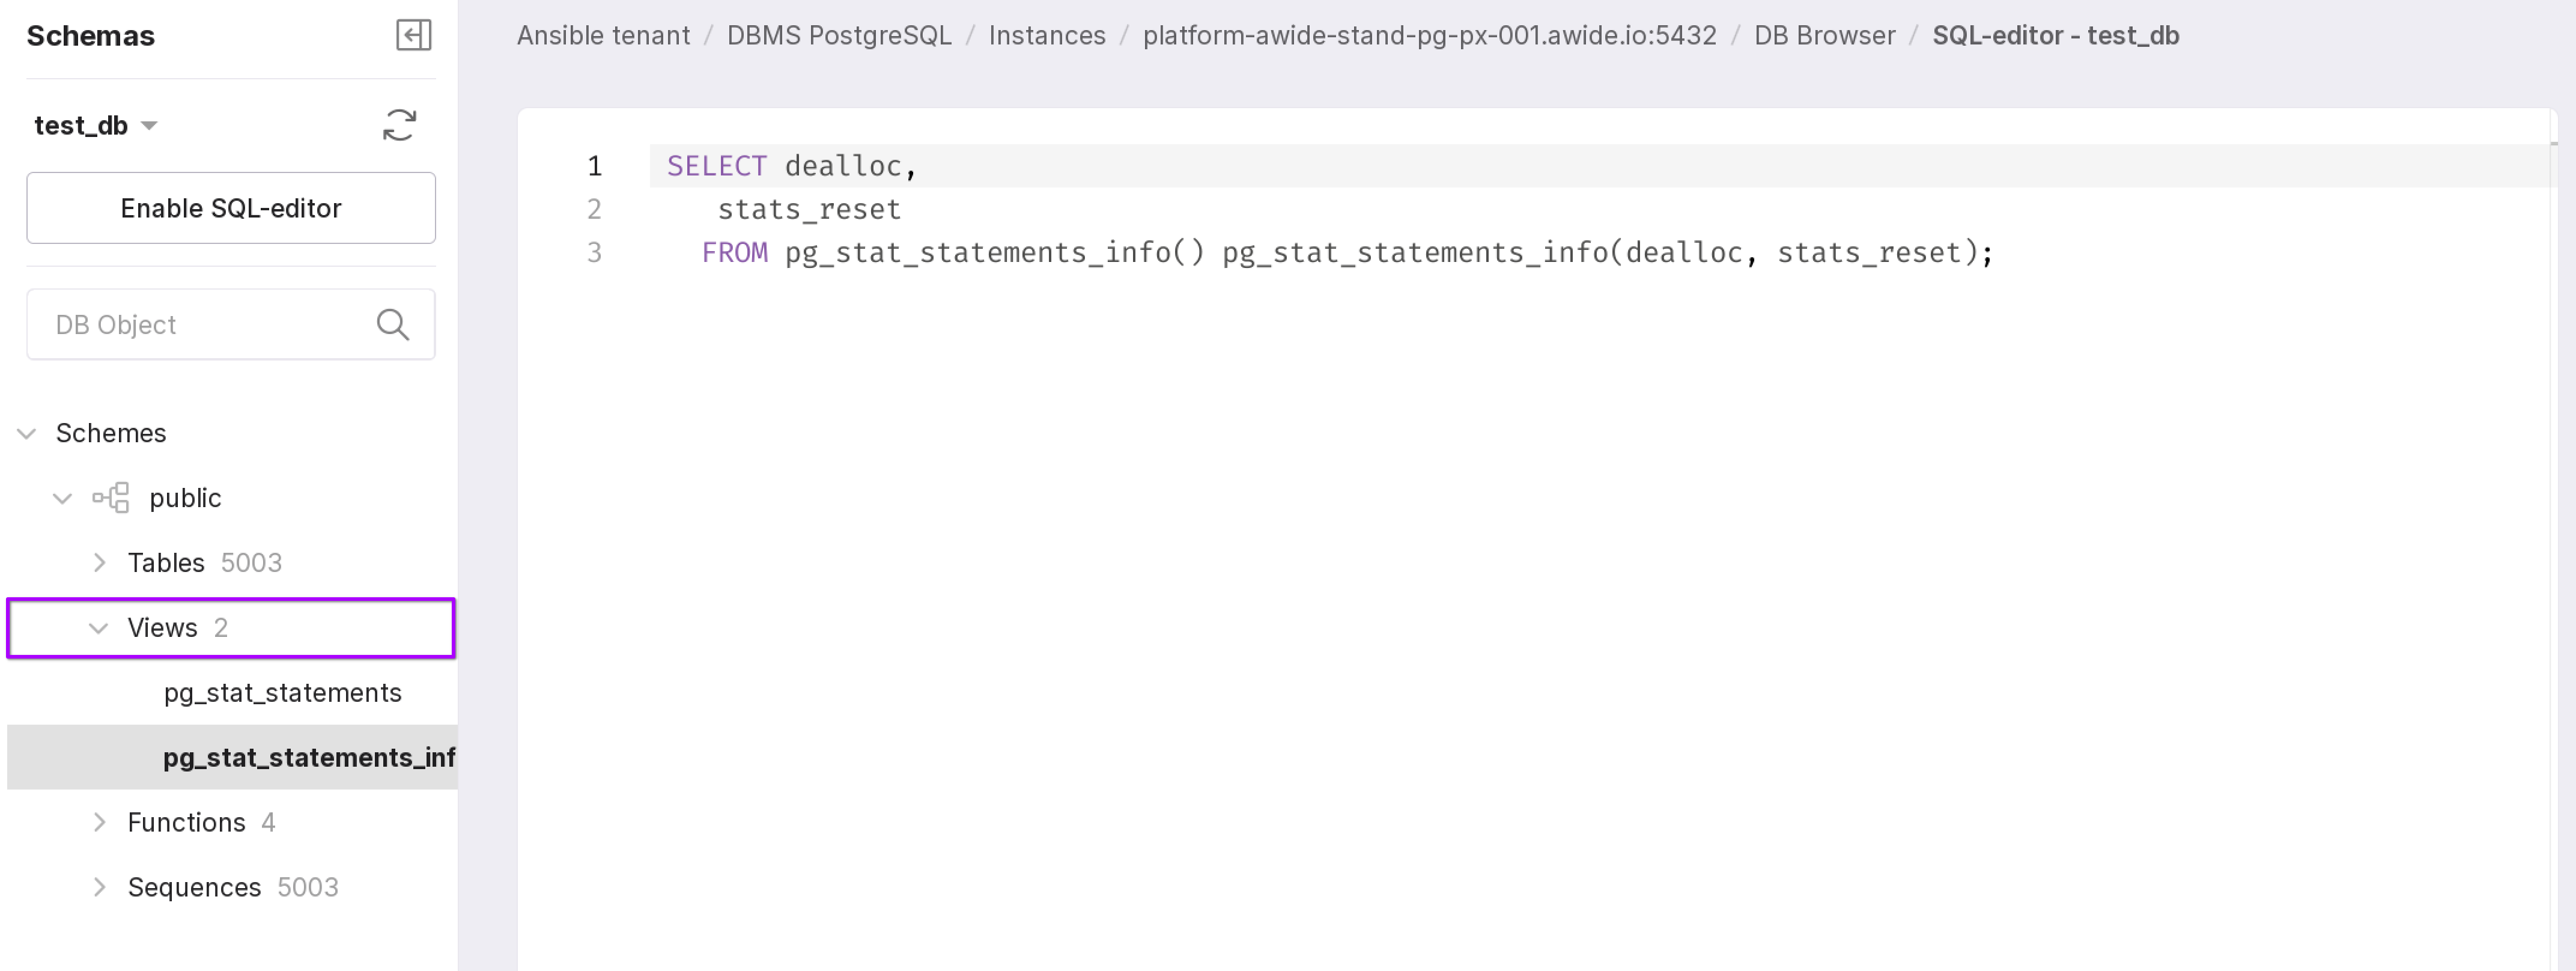
The “Views” section displays the views of this table.
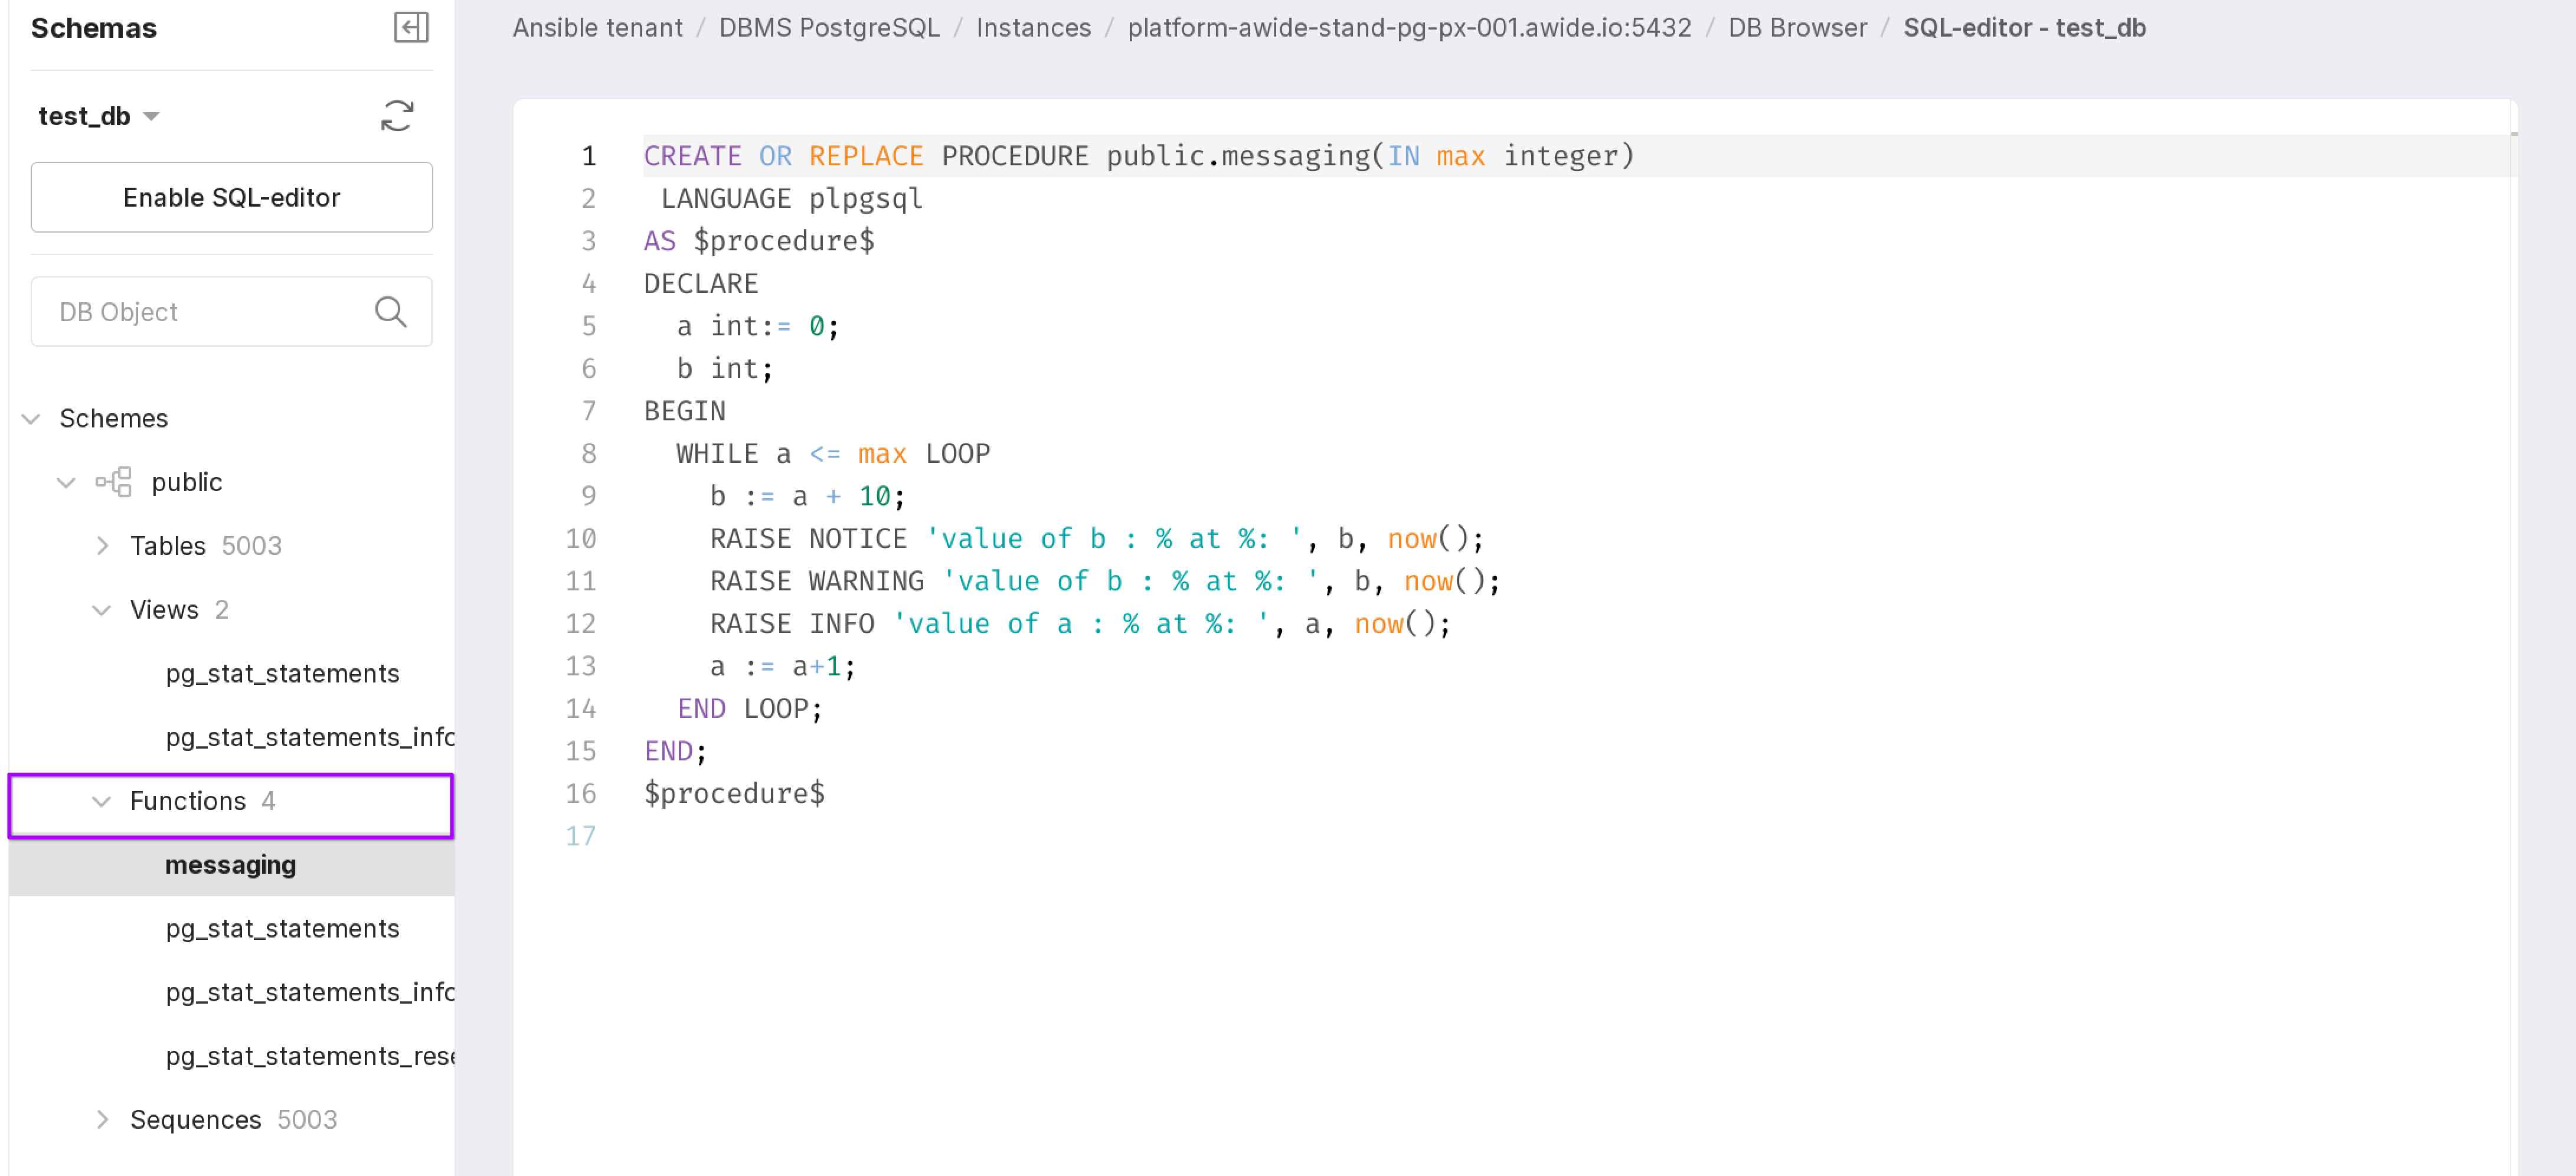
The “Functions” section displays the stored procedures or functions of the table.
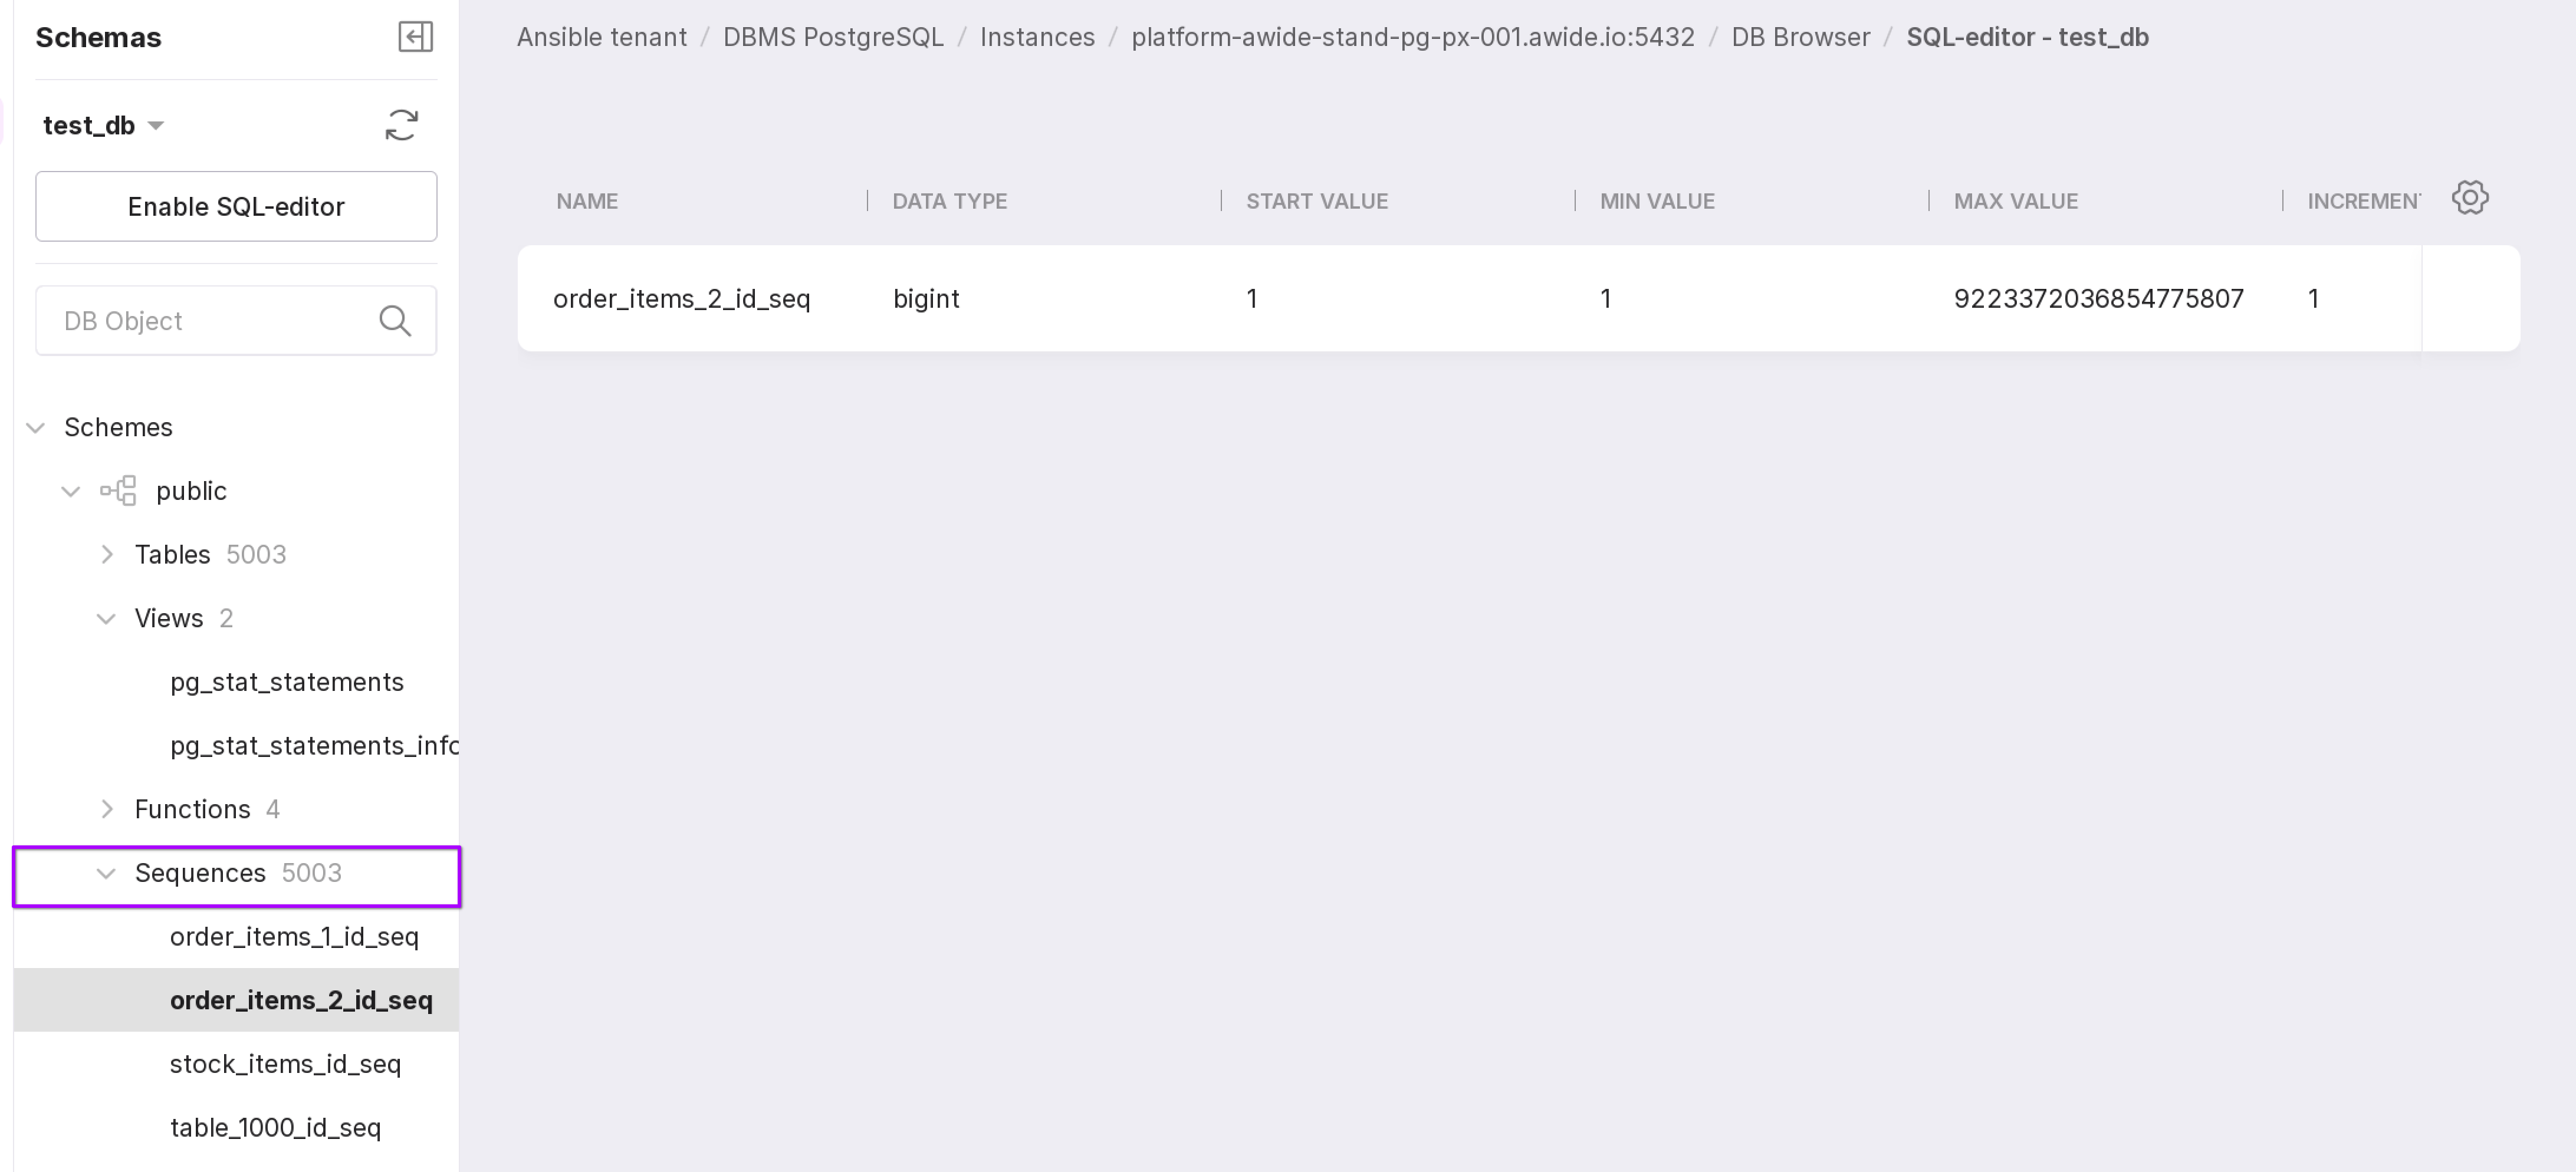
The “Sequences” section displays generated unique numeric values and information on them:
sequence name;
data type;
start value of the sequence;
minimum value of the sequence;
maximum value of the sequence;
increments;
behavior of the sequence (cyclic or not), indicating whether the sequence will restart from the minimum value after reaching its maximum, or return an error;
cache size;
last value.
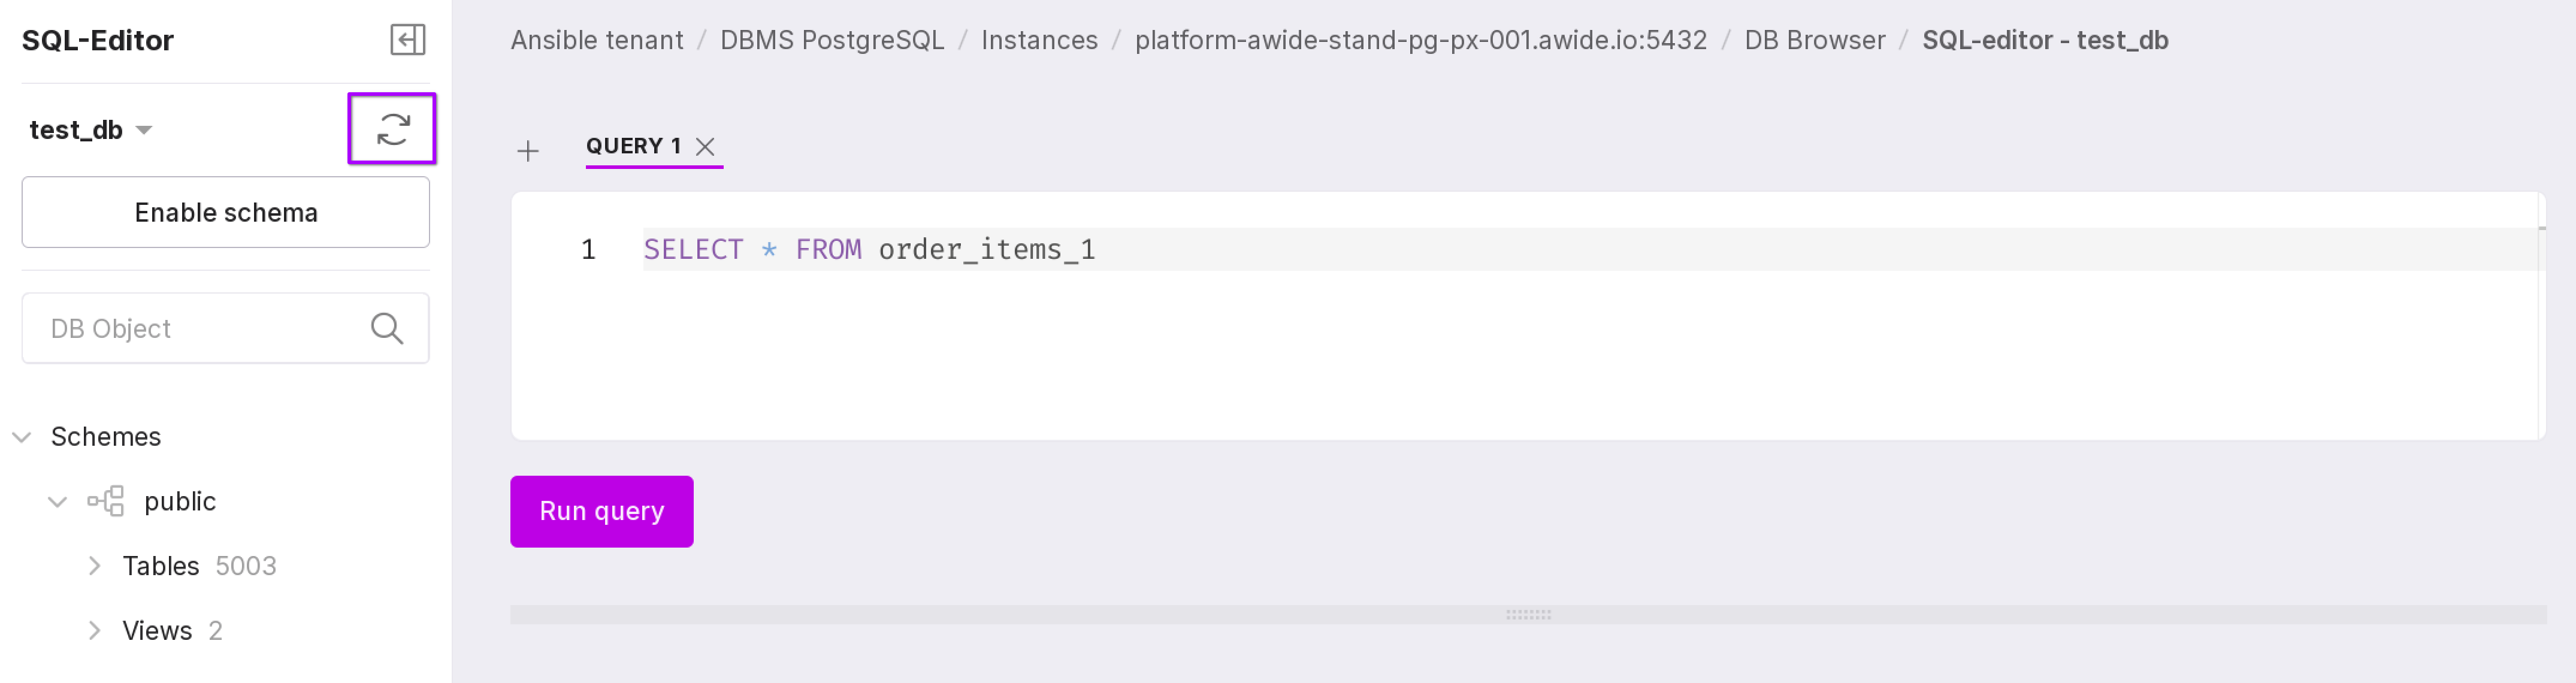
Using the search bar (number 2 in the picture below), you can find any data object by its name.
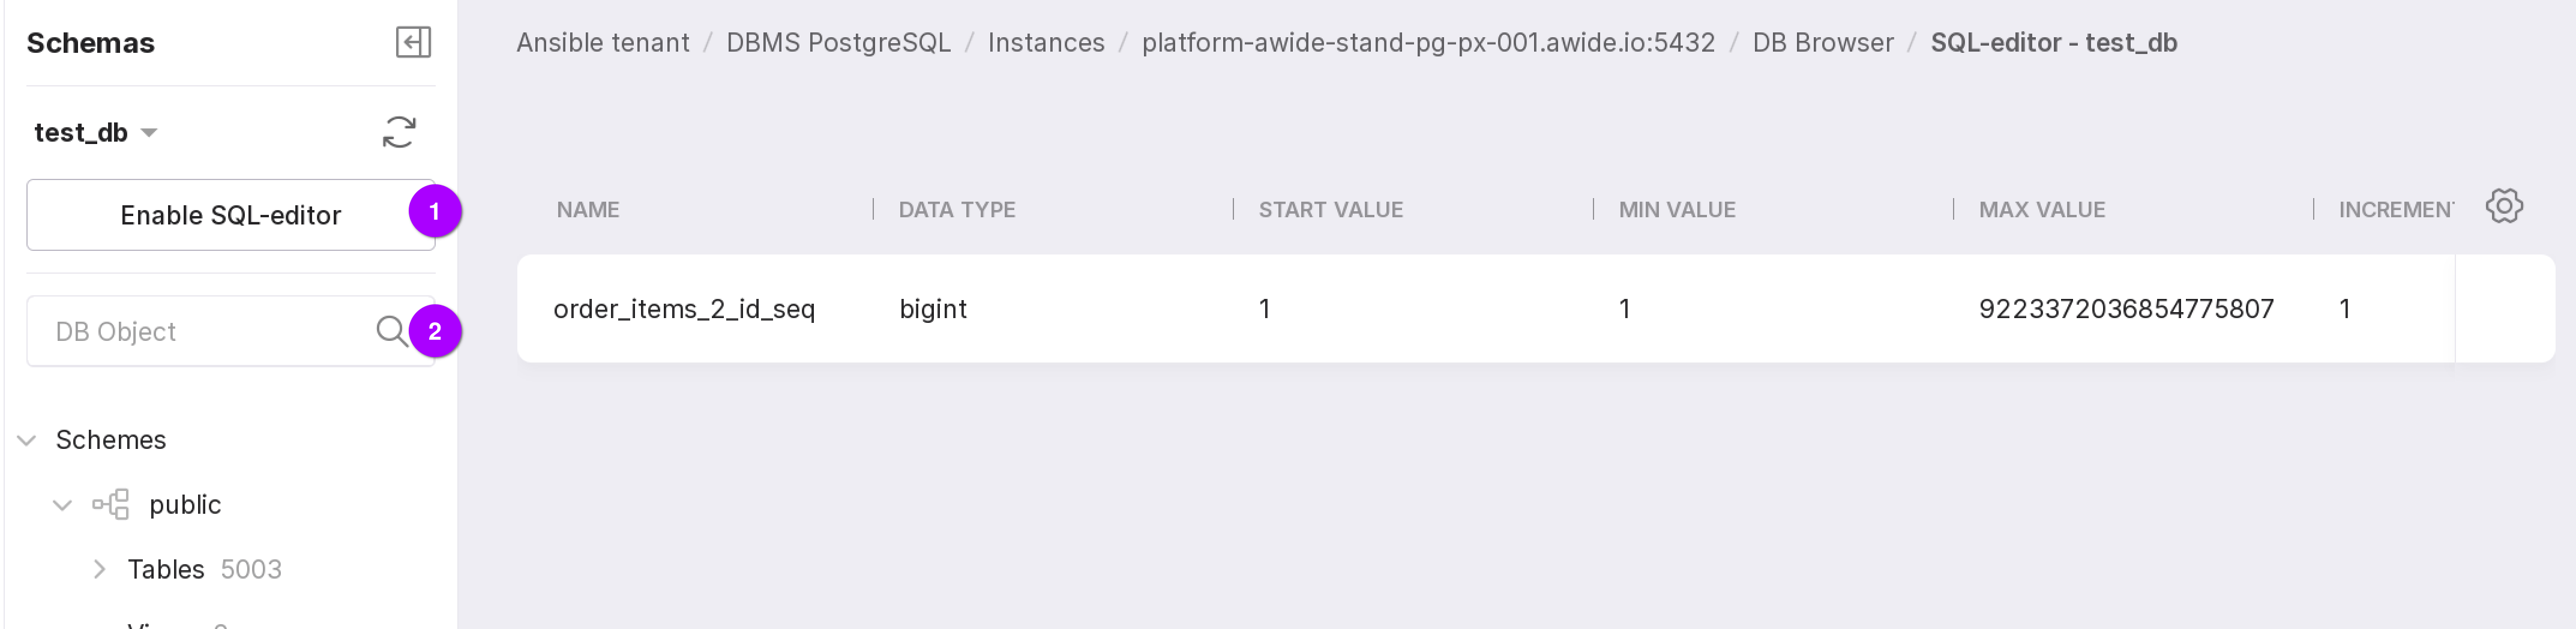
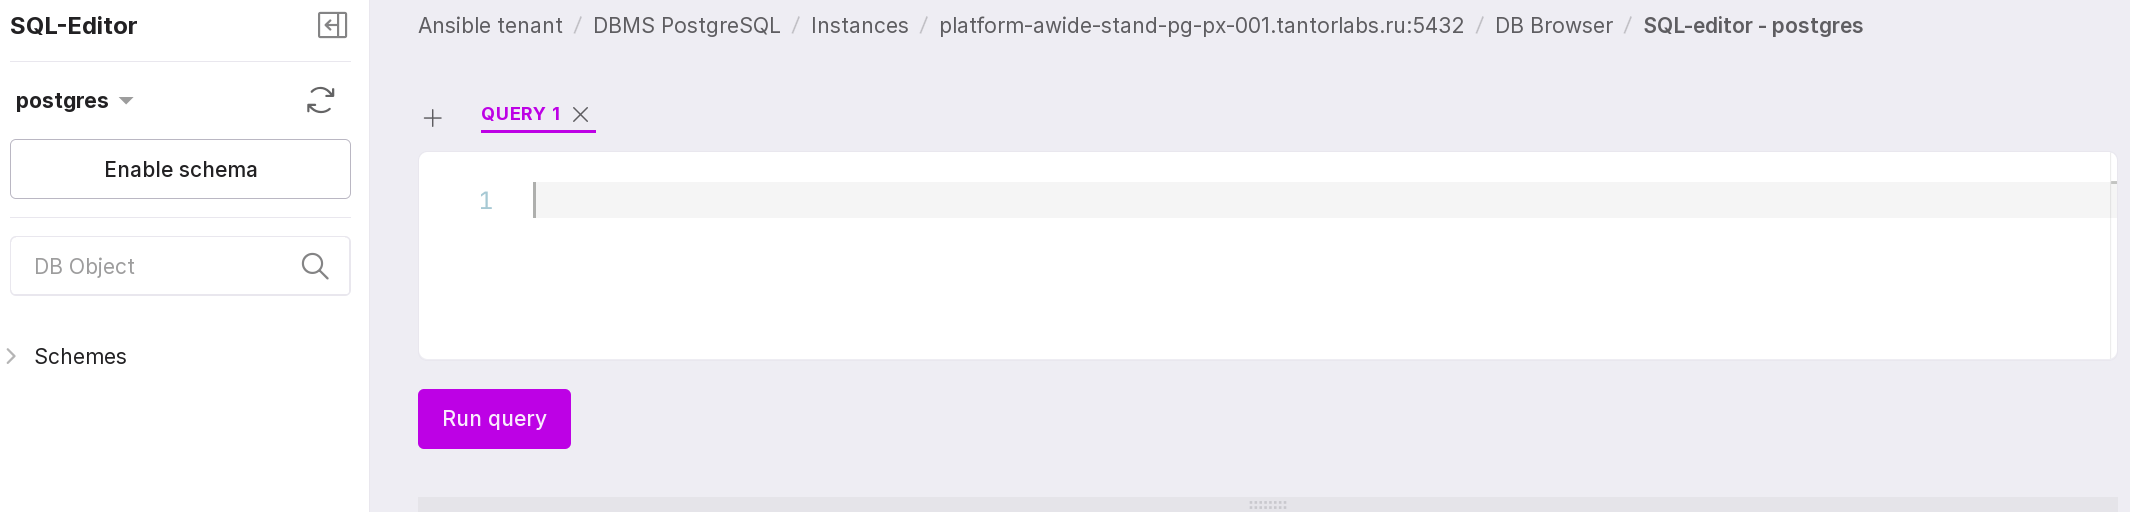
There is also an SQL editor on the page. To open it, click “Enable SQL-editor”, number 1 in the figure above. The editor will open automatically when connecting to the database using the “SQL-editor” button.
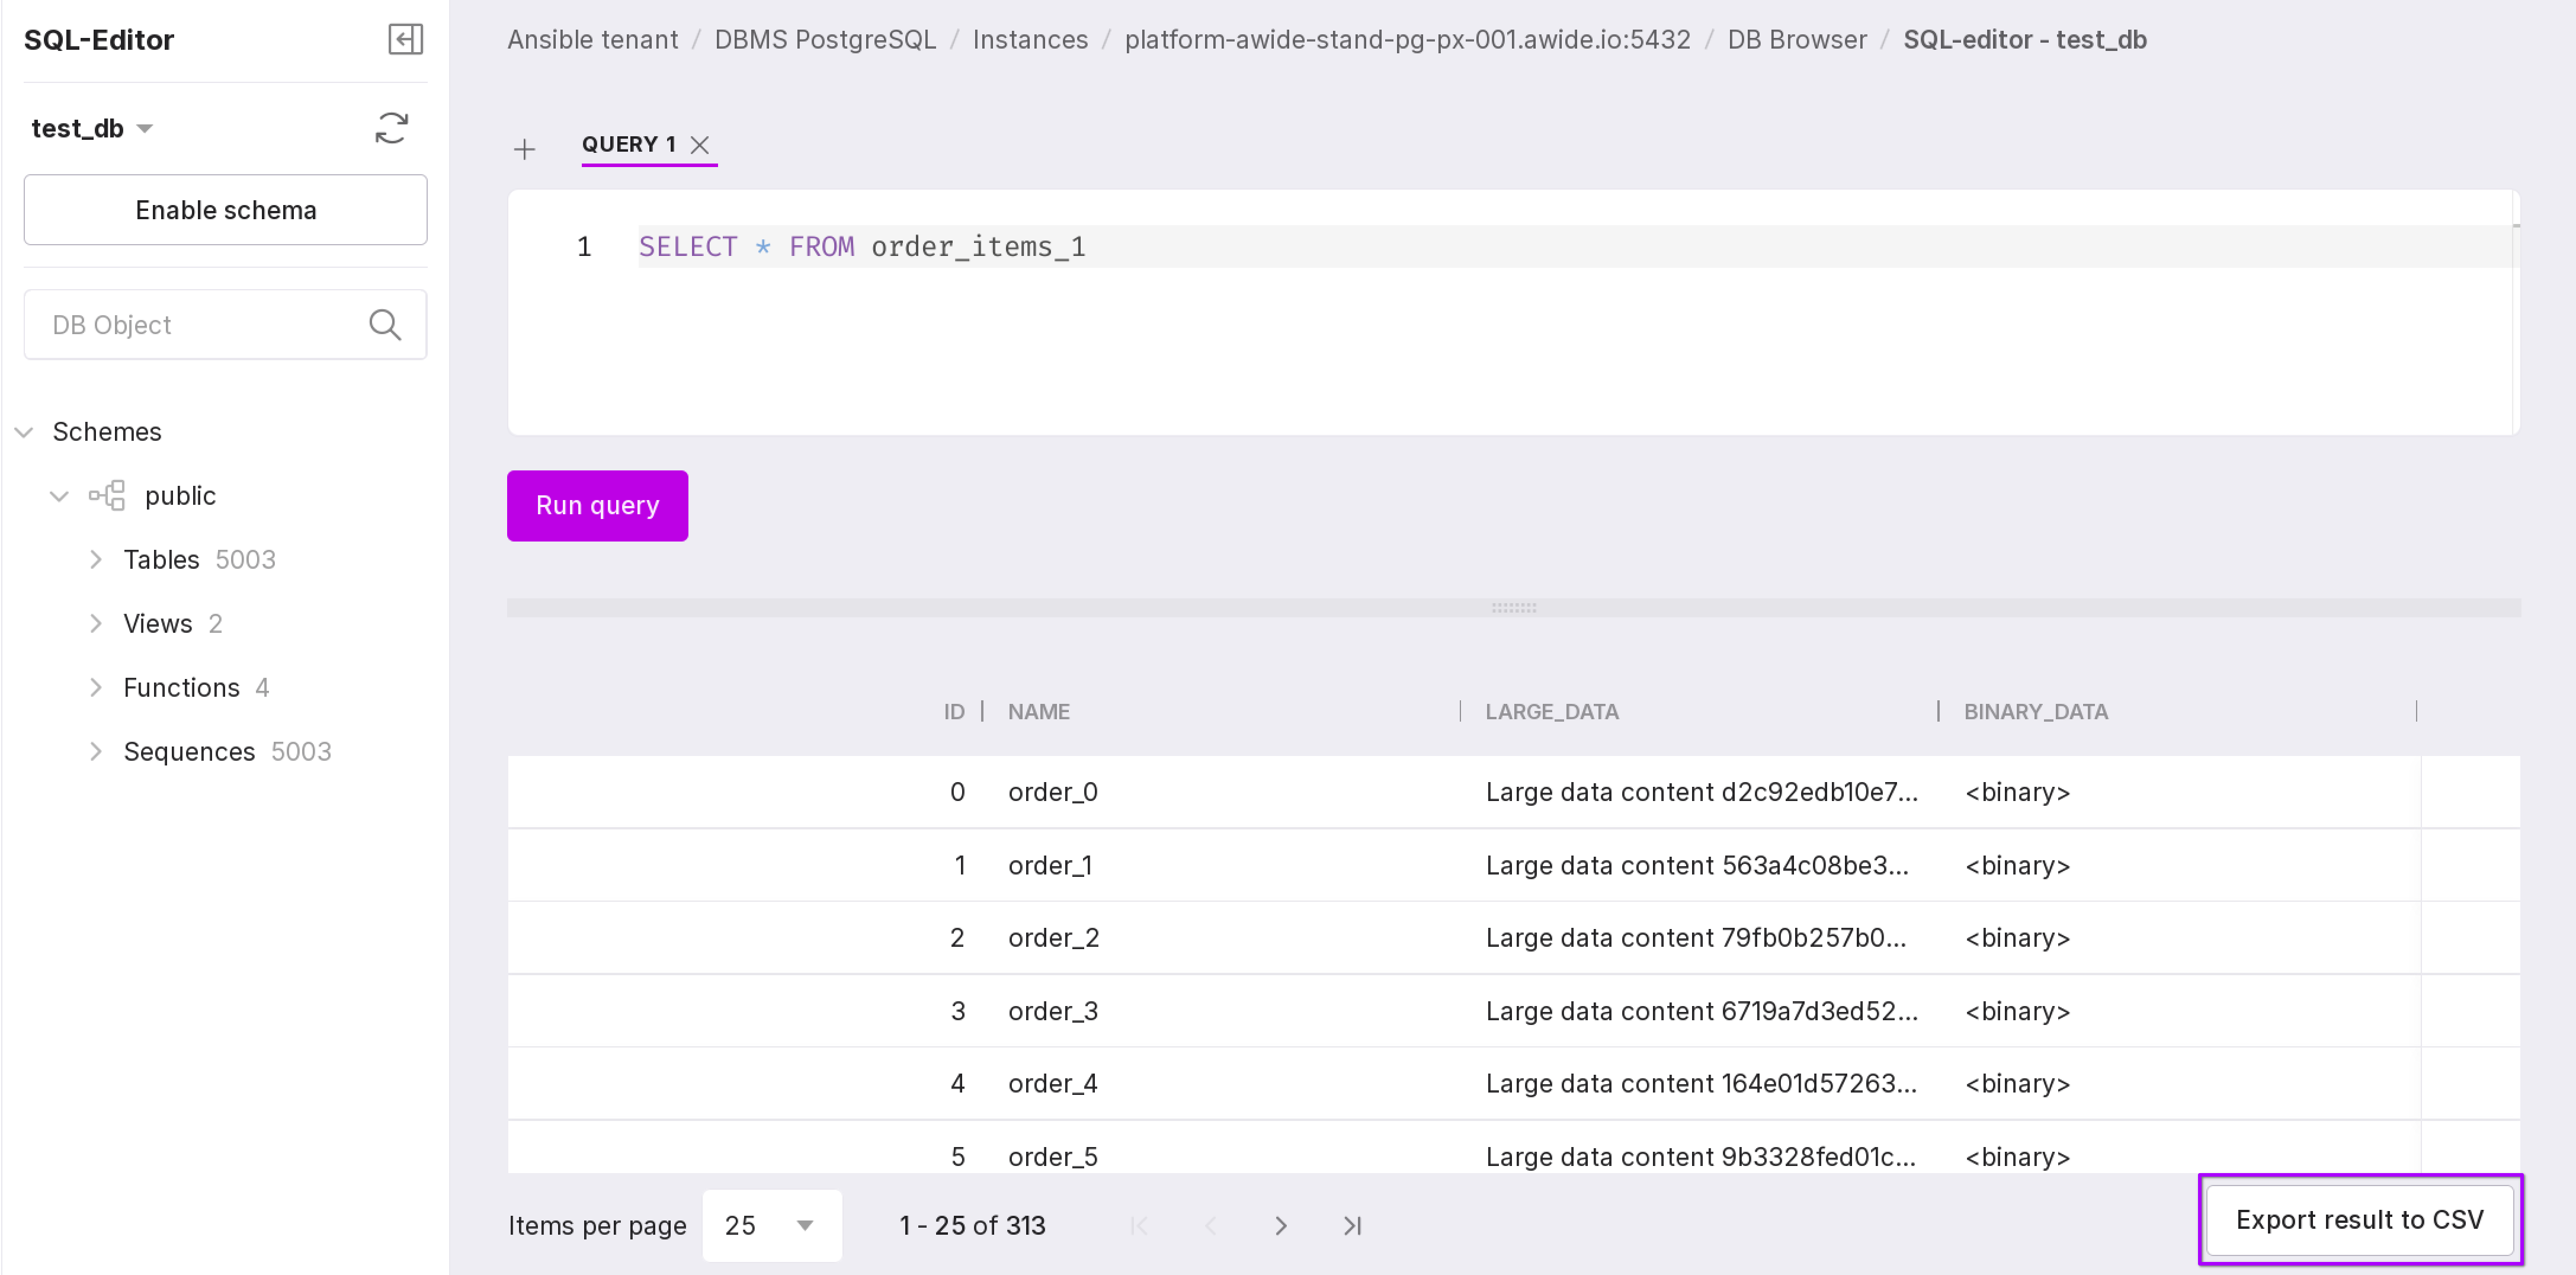
You can write a query to the database in the editor and then execute it using the “Run Query” button. If the query is written correctly, after clicking the button, a green notification will appear indicating that the query has been sent to the server. If the query is incorrect, you will see a red notification with a description of the error.
Attention
If the query requires too many resources to execute, it may fail after the timeout.
The resulting data can be exported to CSV format and downloaded using the “Export result to CSV” button.
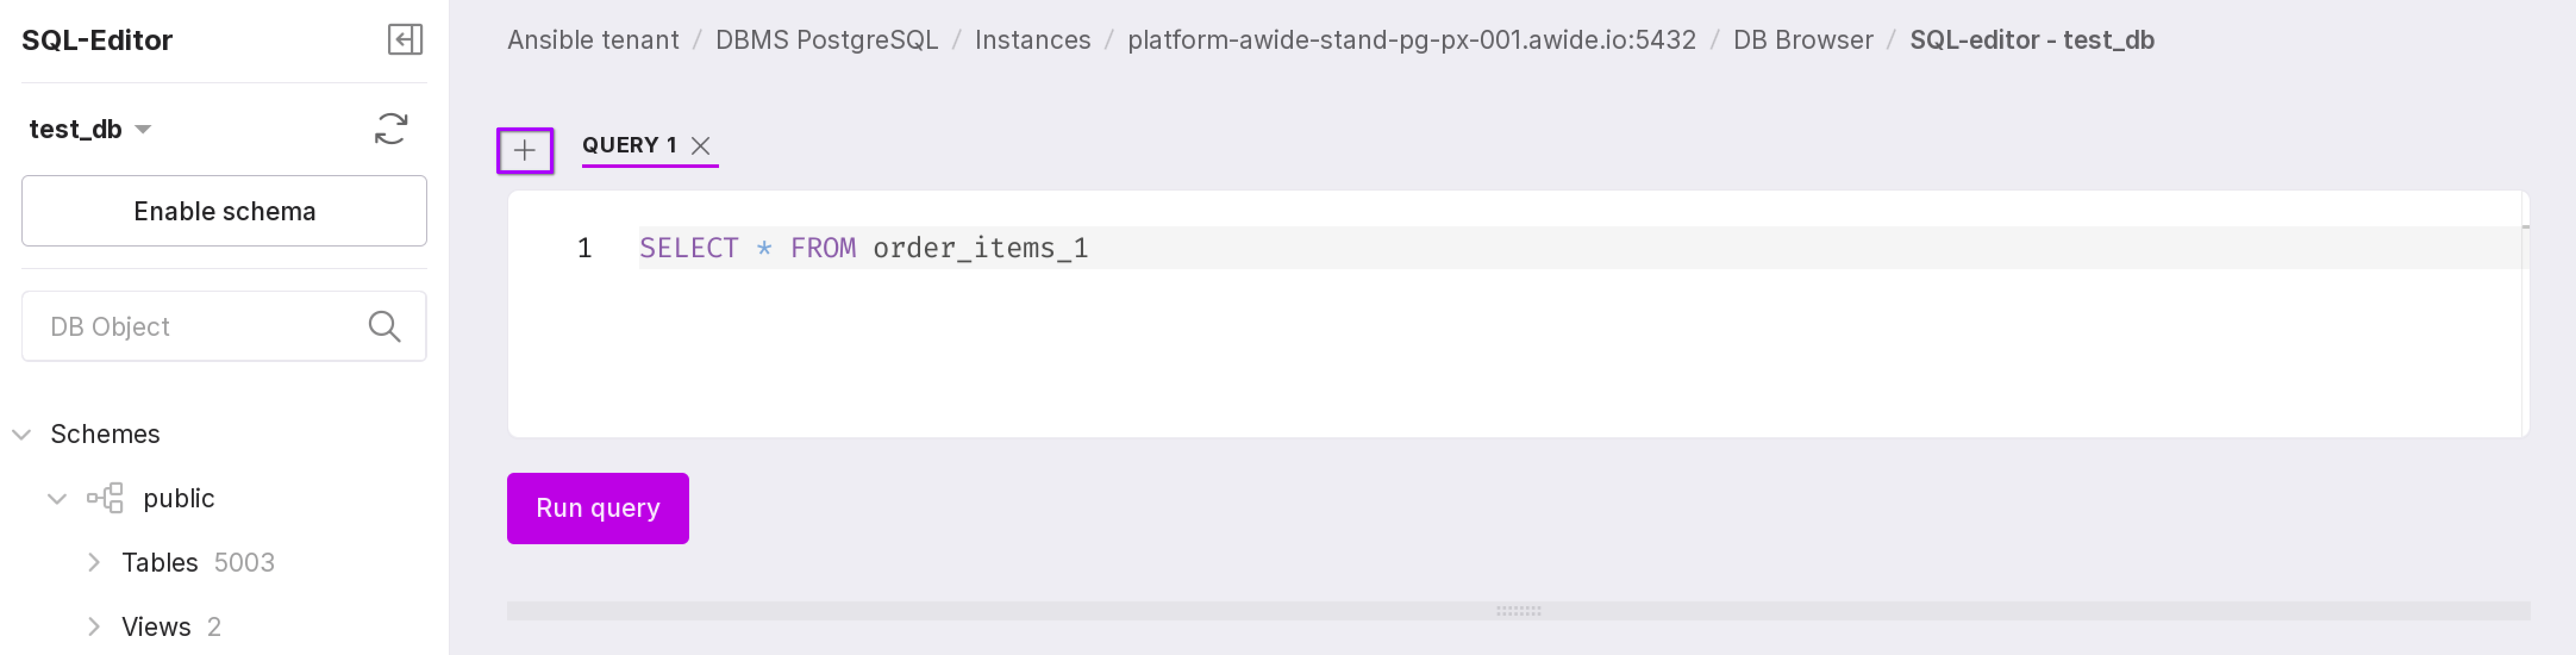
New tabs for queries can be opened using the “+” icon. The maximum number of tabs is 10.
If the written query changes the database structure, click the refresh icon to see the result of its execution.