Platform architecture
This section describes the main components that make up Platform, their functions and interaction.
Main components and their functions
Platform consists of the following components:
The client side is a web interface for administrators that allows you to manage databases.
The server side provides the main functionality of Platform. It consists of the following components:
backend implements the logic of the system and provides an API. Developed in Golang;
Keeper handles input metric streams from agents. Developed in Golang;
pg_configurator, the database configuration recommendation module, offers tips for database configuration. Developed in Python.
Frontend – provides interactivity and friendly interface for users. Developed in JS Angular.
DBMS is the core of the product. It is based on PostgreSQL. It has the following extensions to handle a large number of metrics:
btree_gin,
HTTP,
pg_cron,
pg_framework,
pg_stat_statements,
pg_store_plans,
pipelinedb,
plpgsql,
uuid.
The agent is a lightweight application in Golang that collects information from the database and operating system and sends data with changes to the server side of Platform, provides secure communication with the backend and keeper servers. The agent provides management and configuration of the DBMS, and execution of pre-programmed and scheduled tasks.
NATS Messaging Broker - provides asynchronous messaging and data delivery to the OperDB database.
pg_anon is a tool for anonymizing data in a DBMS.
pg-explain is an advanced analytics module.
Swagger is a set of tools for creating, code generation, and using API documentation according to the OpenAPI specification.
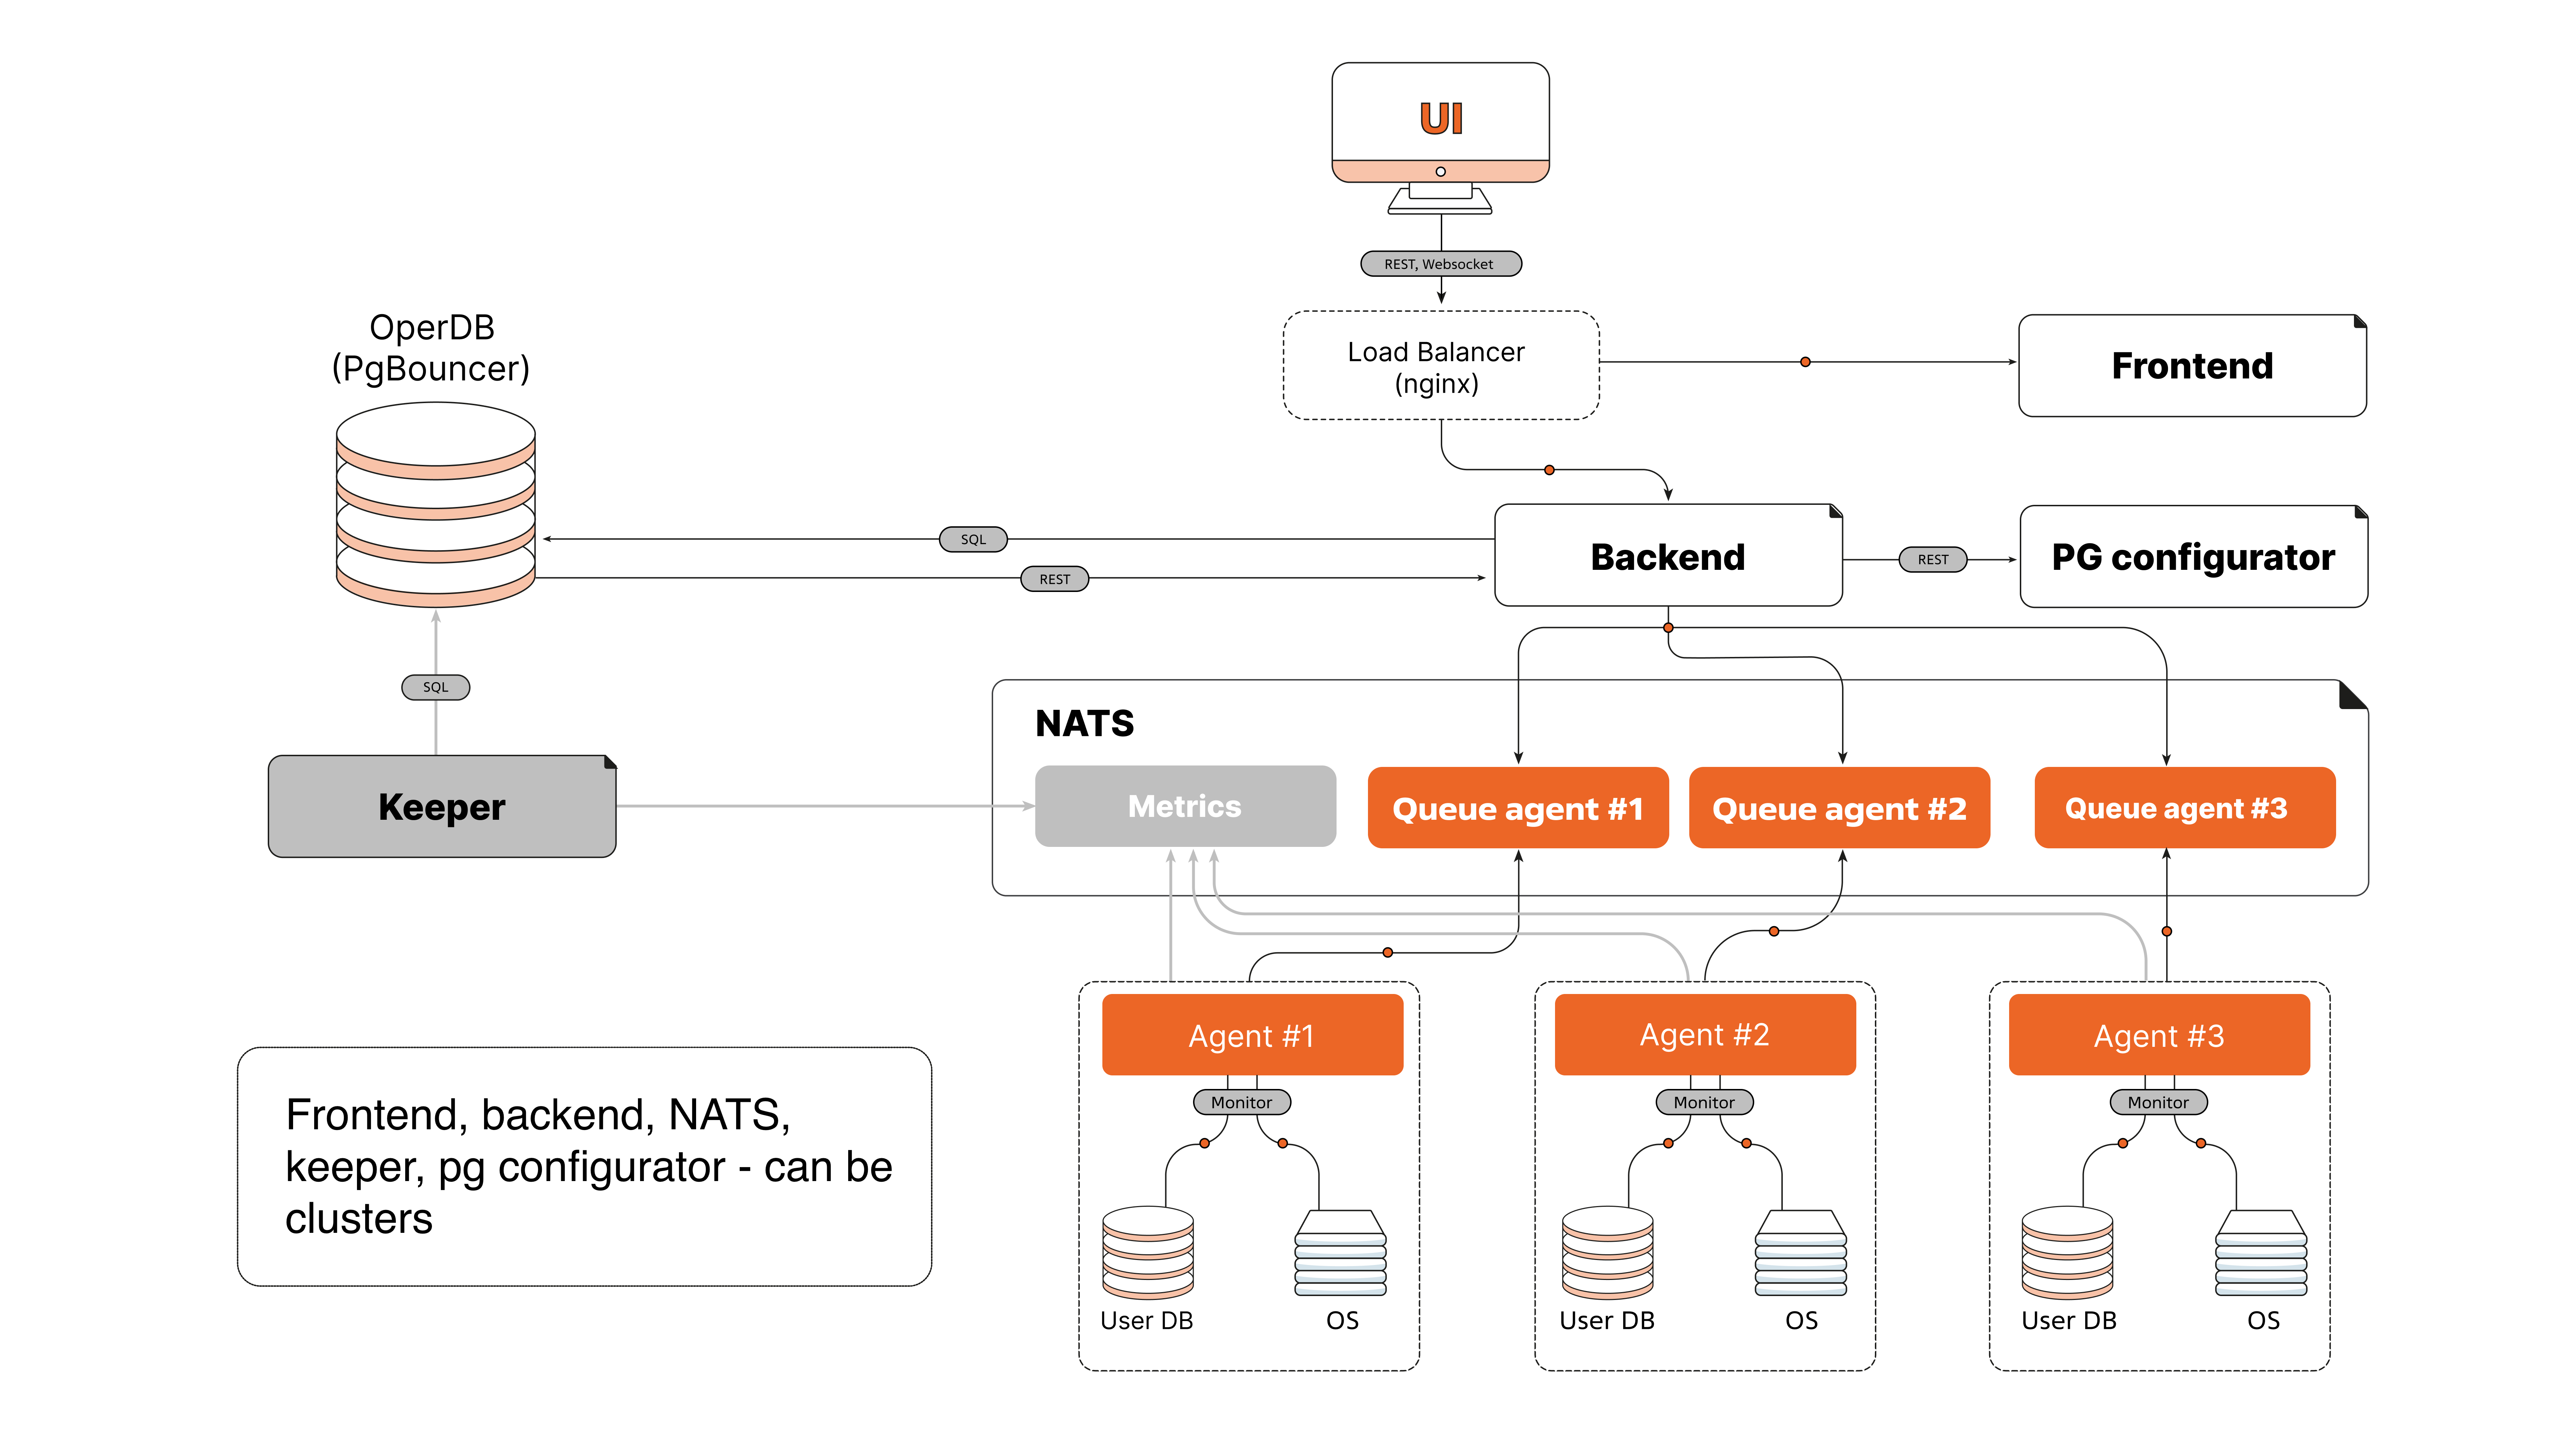
Figure 1 Platform architecture diagram
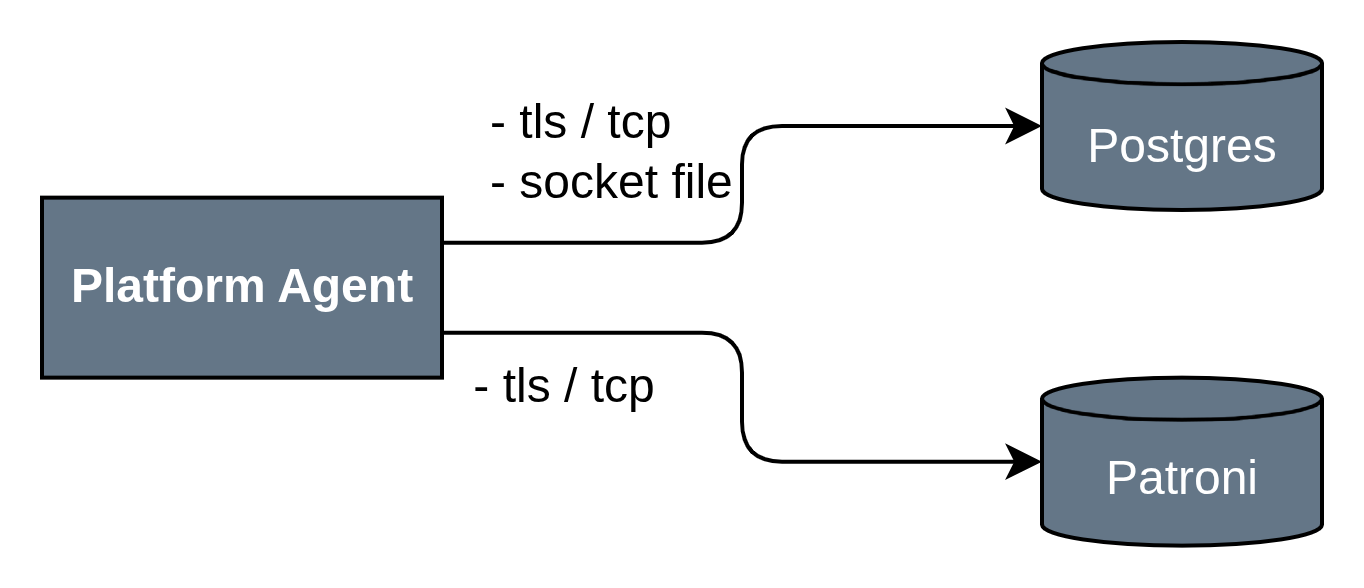
The agent’s interaction with monitoring and management objects
Postgres/AwideDB — the Platform agent interacts with instances of Postgres/AwideDB and other Postgres-like databases using standard DBMS ports and unix socket files.
Patroni — an agent that handles Patroni metric collection and management functions.
Connection Source|Target Component|Port and Protocol |
Comments |
||
|---|---|---|---|
Internal interactions within the server environment (host) |
|||
Platform Agent |
Postgres/AwideDB |
|
Control commands, metric collection Target ports differ depending on the client’s environment |
Platform Agent |
Patroni |
TLS/TCP |
Control commands, metric collection Target ports differ depending on the client’s environment |
Docker-compose
The architecture of connections between Platform components operating in Docker via docker-compose is structured as follows:
Main subsystems
Monitoring and management subsystem.
Browser components interact with the server side of Platform via a common Reverse Proxy (nginx), which listens on HTTP and HTTPS ports (80, 443). The Reverse Proxy is also involved in some interactions between the server elements of the Platform.
The external agent (Platform Agent) connects to nginx via TCP:4222 and HTTPS:443.
Swagger UI is available at HTTP:8080.
The Platform Frontend component interacts with nginx via HTTP:80.
Flyway and NATS exchange data via TCP:4222.
Keeper, pgbouncer, OperDB (AwideDB), MainDB use TCP:5432 for database connections.
The server/Backend interacts with various services via HTTP:5666, HTTP:80 and through databases via TCP:5432.
Subsystem of advanced analytics.
pg_explain is available via HTTP:80 and HTTP:443.
pg_monitor (dispatcher and collector) operates via TCP:5432.
Interaction with the user interface.
Platform UI and Tensor UI are available for the browser through Reverse Proxy (nginx) via HTTP:80 and HTTPS:443.
External services.
Interaction flows.
All incoming external connections (from Agent, browser) go through nginx (Reverse Proxy).
Internal services and databases connect to each other mainly via TCP:4222 (NATS, Flyway, Keeper) and TCP:5432 (pgbouncer, MainDB, OperDB, pg_monitor).
Authorization and integration with external systems are implemented through separate services connected to the Backend via the corresponding ports.
Connection Source |
Target Container |
Port and Protocol |
Comments |
|---|---|---|---|
Internal Interactions |
|||
Platform Agent |
Reverse Proxy (nginx) |
TCP:4222, HTTPS:443 |
Control commands, telemetry, installation packages for new agent versions |
Reverse Proxy (nginx) |
swagger_ui |
HTTP:8080 |
Swagger UI |
Reverse Proxy (nginx) |
Platform Frontend |
HTTP:80 |
User Interface |
Reverse Proxy (nginx) |
Server / Backend |
HTTP:5666 |
Access to Platform API |
Platform UI (browser) |
Reverse Proxy (nginx) |
HTTP:80,HTTPS 443 |
Platform User Interface |
Tensor UI (browser) |
Reverse Proxy (nginx) |
HTTP:80, HTTPS:443 |
User Interface for Advanced Analytics Tools |
pg_anon |
Reverse Proxy (nginx) |
HTTP:80 |
Asynchronous Responses to anonymization requests |
pg_configurator |
Server / Backend |
HTTP:7777 |
Postgres Configuration Generation |
Server / Backend |
pg_anon |
HTTP:8080, HTTP:5666 |
Requests for Anonymization |
Flyway |
pgbouncer |
TCP:5432 |
Database Migrations |
Server / Backend |
NATS |
TCP:4222 |
Interaction with Platform Data Exchange Subsystem |
pgbouncer |
OperDB (AwideDB) |
TCP:5432 |
Interaction with Database |
pgbouncer |
MainDB |
TCP:5432 |
Interaction with Database |
Keeper |
pgbouncer |
TCP:5432 |
Interaction with Database |
pg_explain |
pg_monitor (dispatcher) |
TCP:5432 |
Interaction with Database |
pg_monitor (dispatcher) |
pg_monitor (collector) |
TCP:5432 |
Interaction with Database |
External Interactions |
|||
Server / Backend |
Active Directory, LDAP, ALD Pro |
TCP/TLS:389, 636, 88, 3268 or 3269 depending on the system |
External Authentication |
Server / Backend |
|
HTTPS:443 |
Integrations with third-party systems |
Server / Backend |
SMTP |
TCP/TLS:25, 587 |
Sending email notifications |
The architecture follows a microservices approach, with each component running in its own Docker container and communicating via standardized network ports and protocols. The main entry and routing point is the Reverse Proxy (nginx). It provides security and load balancing across Platform services.
Clustering
The platform supports the ability to deploy database instances in clusters, allowing efficient system scaling and high fault tolerance.
Platform clustering is supported by Patroni Python application, which is based on streaming replication. The application allows you to transform your system from leader-follower nodes to a highly available cluster with automatic controlled failover and emergency failover.
Patroni can easily add new replicas to an existing cluster and modify the DBMS configuration simultaneously on all nodes in the cluster. Patroni supports synchronous replication, configurable switch-over actions, REST APIs, and running user commands to create a replica. Patroni also interacts with Kubernetes and offers many other features.
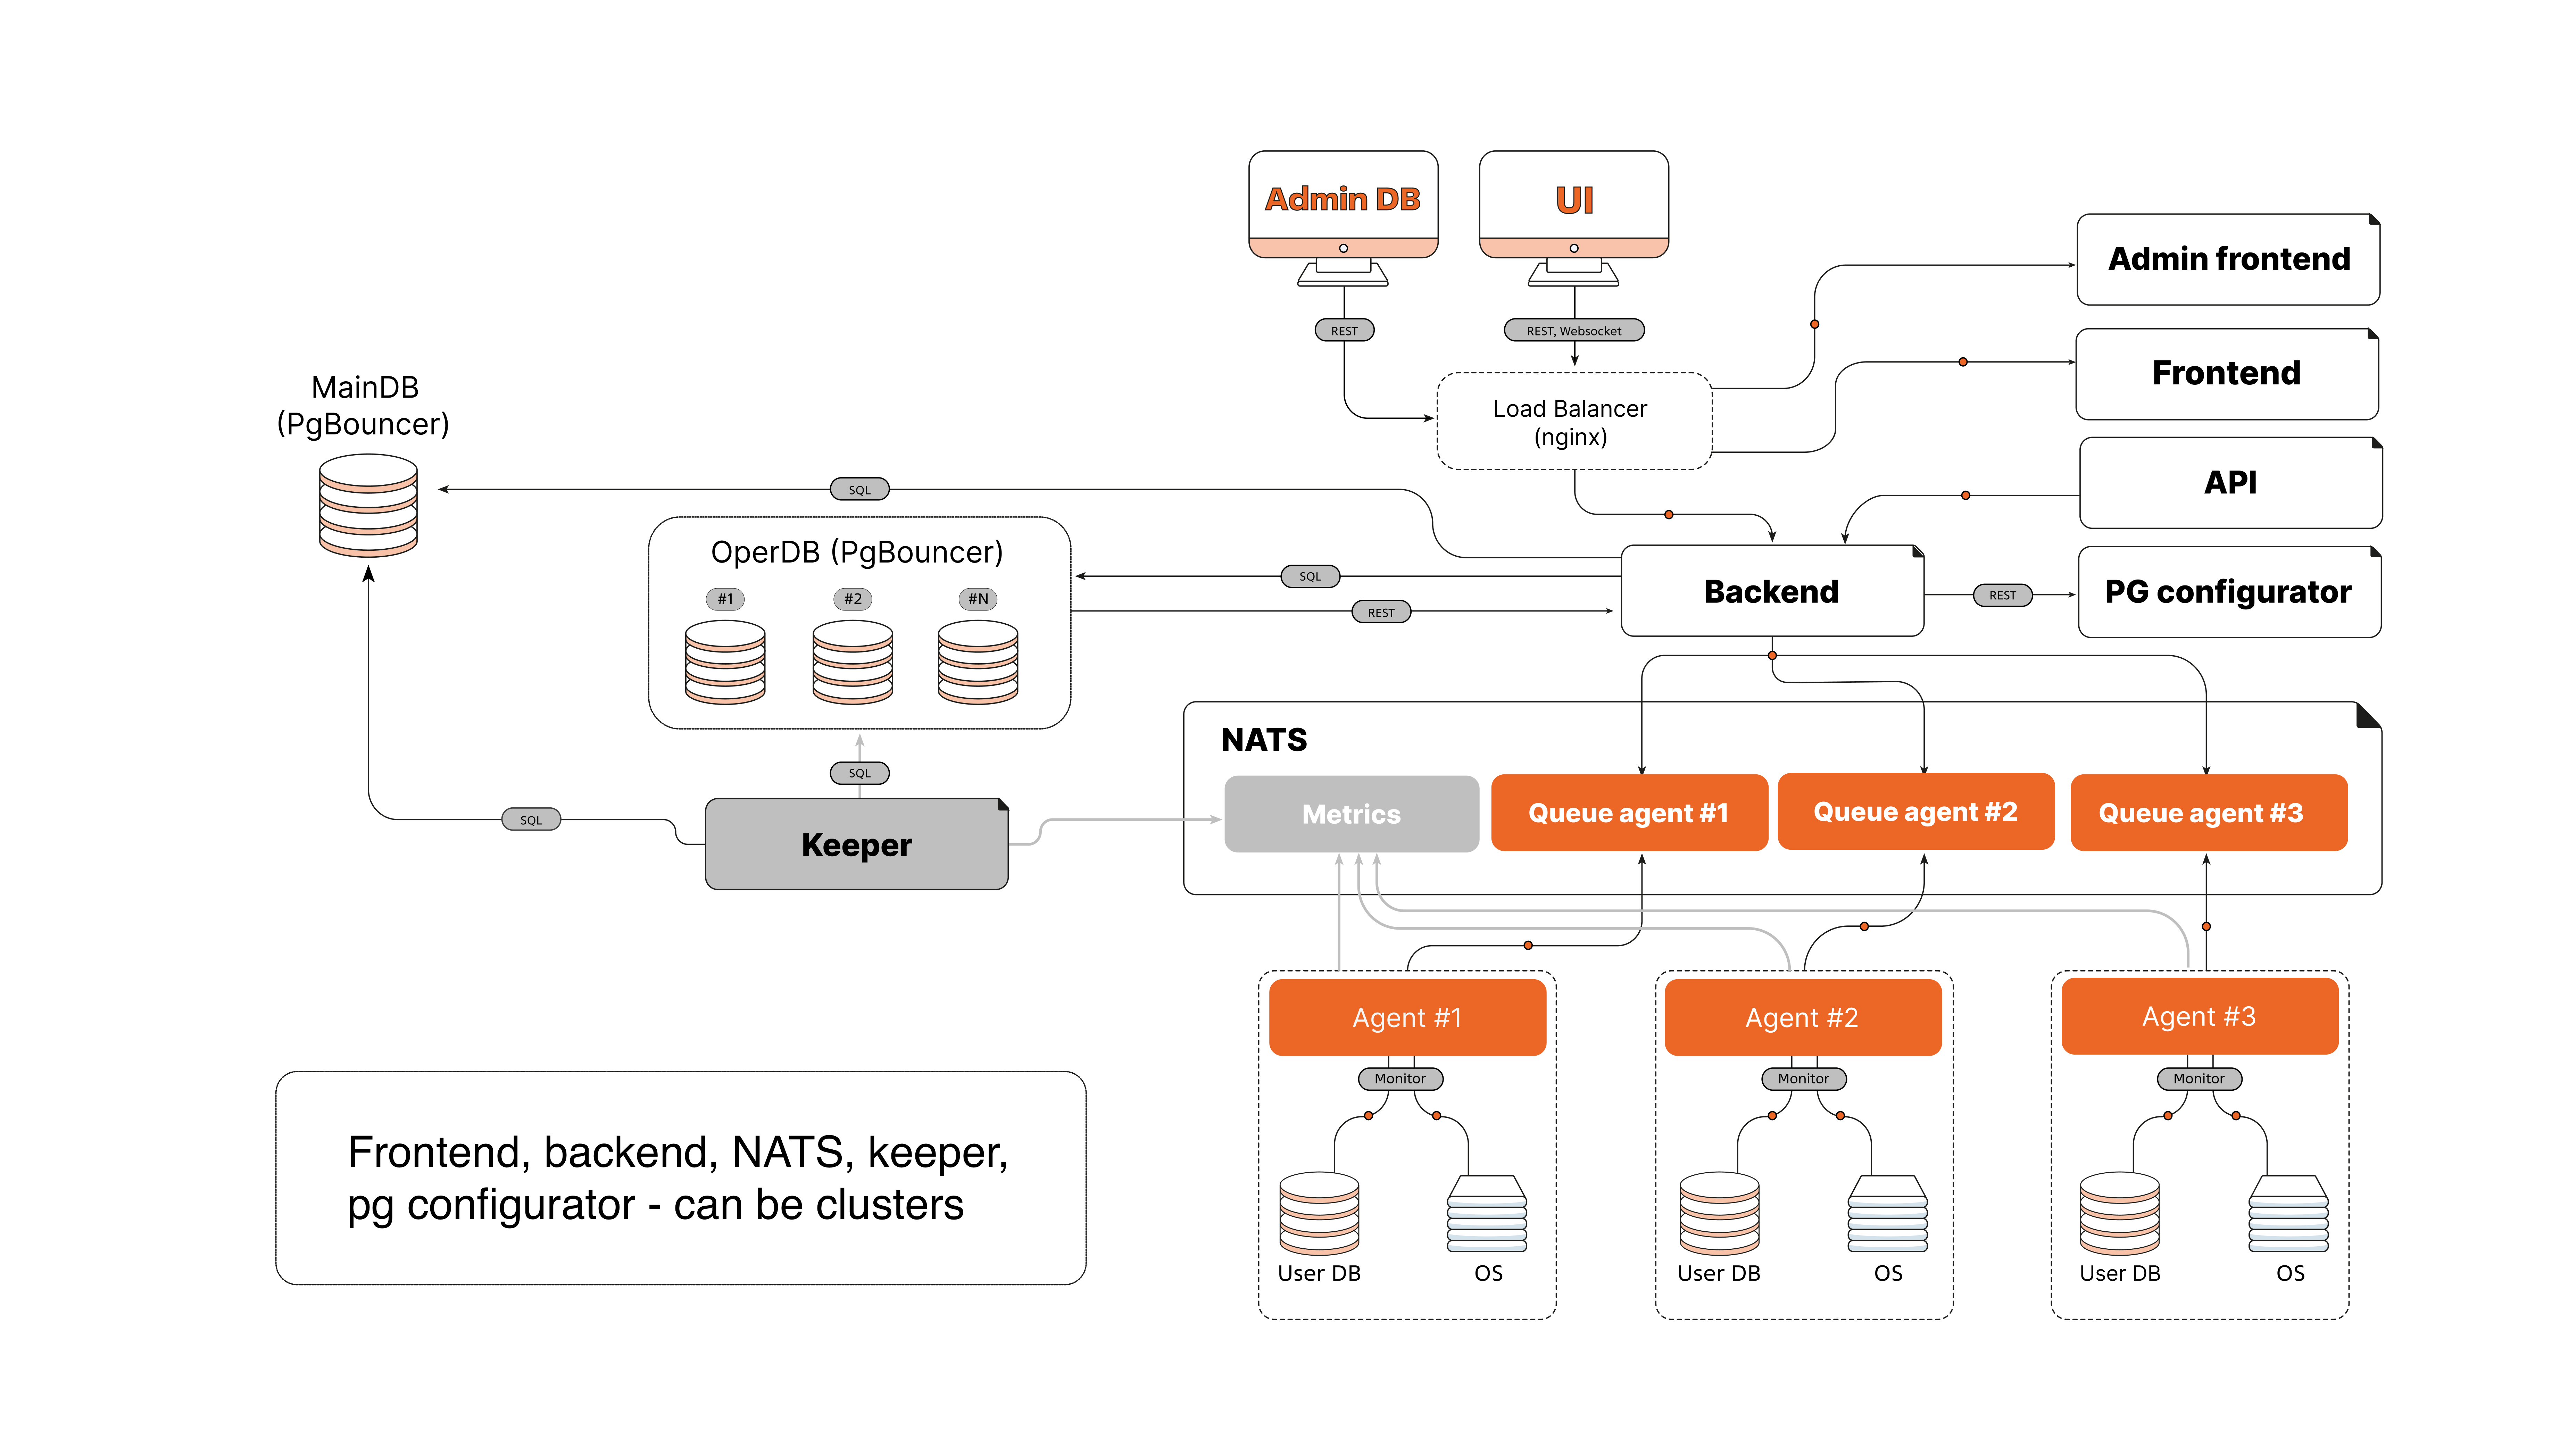
Figure 2 Scalable platform diagram
Package installation
The deployment architecture of Platform on virtual machines (VMs) implies the installation of multiple components on some of VMs. Installation and configuration of components is managed via Ansible. All interactions are handled in the isolated network of Platform.
Note
This deployment architecture is presented for reference. The actual implementation may vary depending on the architectural features of the Customer.
Groups of components
External interfaces.
The Platform Agent and browser clients (Platform UI, Tensor UI) connect to Platform via an external load balancer (nginx) and a reverse proxy.
All external connections go over channels TCP:4222, HTTPS:443.
A separate server with flyway, ansible, and nginx (local repository) is used for administration.
External load balancer.
Nginx running on port TCP:4222 provides publishing access to the NATS messaging subsystem.
It provides traffic routing between clients and the internal services of Platform.
Keepalived to provide a VIP (Virtual IP Address), ensuring the fault tolerance of the Platform component and serving as a single entry point to the component.
Reverse Proxy.
Nginx receiving HTTP(s) on ports 80, 443, 8443, 5666 and redirecting requests to ports 4200, 8000, 8080.
Keepalived to provide a VIP (Virtual IP Address), ensuring the fault tolerance of the Platform component and serving as a single entry point to the component.
Grouped functional logic.
Contains several components of the solution:
Backend,
pg_configurator,
Keeper,
Nginx (Platform UI),
Swagger,
pg_explain and Tensor_ui,
pg_anon.
Services interact with each other and with other subsystems through internal proxies and load balancers.
Log collection and request analysis system.
PG Monitor Collector (8000) and PG Monitor Dispatcher (8001, 9000), providing the functionality of the extended analytics system.
NATS messaging subsystem.
3 instances of NATS running on NATS ports: 4222, 6222, 8222.
It provides message queues between the components of Platform.
Internal proxies and load balancers.
The internal load balancer (VIP) routes traffic between the components of Platform.
Ports used: TCP proxy:4222
AwideDB/Postgres subsystem.
Oper DB (AwideDB): port 5432,
Main DB (AwideDB): port 5432,
Tensor DB: port 5432.
Administration server.
Used to run Ansible playbooks and configure components.
For each VM, Ansible installs the required components according to the VM role: load balancer, proxy, application server, collector, database, NATS, etc.
Interaction flows.
Connection source (package group) |
Target group |
Port and protocol |
Comments |
|---|---|---|---|
Internal interactions |
|||
Platform UI and Tensor UI |
Reverse Proxy (nginx) |
HTTP:80, HTTPS:443 |
User interface |
Platform Agent |
External Load Balancer |
TCP:4222, HTTP(S):80(443) Protocol and port may differ depending on the customization of the Platform instance |
Control commands, telemetry installation packages for new versions of Agent. |
External Load Balancer |
NATS |
TCP:4222 |
Load balancing of access requests to NATS |
Reverse Proxy |
Functional logic |
HTTP
|
Access to functional ports |
Administrative server |
All servers |
SSH/TLS:22 |
Management and configuration |
All servers |
Administrative port |
TCP (HTTP):80 |
Working with the local repository and package installations |
Administrative Server |
Subsystem AwideDB / Postgres
|
TCP:5432 |
Management and Configuration |
Internal Load Balancer |
Subsystem AwideDB / Postgres
|
TCP:5432 |
Access to Postgres |
Internal Load Balancer |
NATS |
TCP:4222 |
Interaction with the data exchange subsystem of Platform |
NATS |
NATS |
TCP:6222 |
State exchange (heartbeats) |
Any client with Platform network access |
NATS |
HTTP:8222 (access to telemetry) |
NATS UI component |
Tensor Collector (collector and dispatcher) |
Internal Load Balancer |
TCP:5433 |
Access to Postgres |
Application Server (collector and dispatcher) |
Internal Load Balancer |
TCP:
|
Access to Postgres and NATS |
This architecture provides scalability, fault tolerance, and centralized management of the Platform components. Using Ansible allows to automate installation, updating, and configuration of all services on virtual machines.
Platform architecture features
Client-server architecture: Platform is based on a client-server architecture in which the client side is a web interface and the server side consists of several modules written in Golang, Python and JS Angular.
Metrics Collection: Metrics are collected through Agent. The agent monitors the database and operating system. It collects information on metrics from the administered database and sends them through the NATS messaging broker to the backend server. The agent also can send newly changed data based on snapshots and data preaggregation to reduce network traffic and server load.
Metrics storage: Metrics are stored in a PostgreSQL-based DBMS, which has been supplemented with special extensions to process a large number of metrics on the fly. The received data is stored in OperDB and can be distributed across namespaces.
DBMS Log Collection and Storage: With the optional pg-monitor service, you can configure the collection and analysis of DBMS logs, and visualize them in the GUI. This service is optional because it requires an additional secure ssh connection to the monitored instances.
Scaling: Platform supports horizontal scaling of most components.
Failure tolerance: Platform provides fault tolerance by duplicating core components.
Security: The Agent execution environment does not require additional open network ports. However, Agent needs to have a network connection to the NATS ports as a data exchange point with the server side of Platform. The Agent is also run as the postgres user, which on the one hand allows for deep integration with the DBMS, and on the other hand minimizes its impact not by the operating system environment.