Charts
To open this page, click “Charts” in the instance’s left-hand menu.
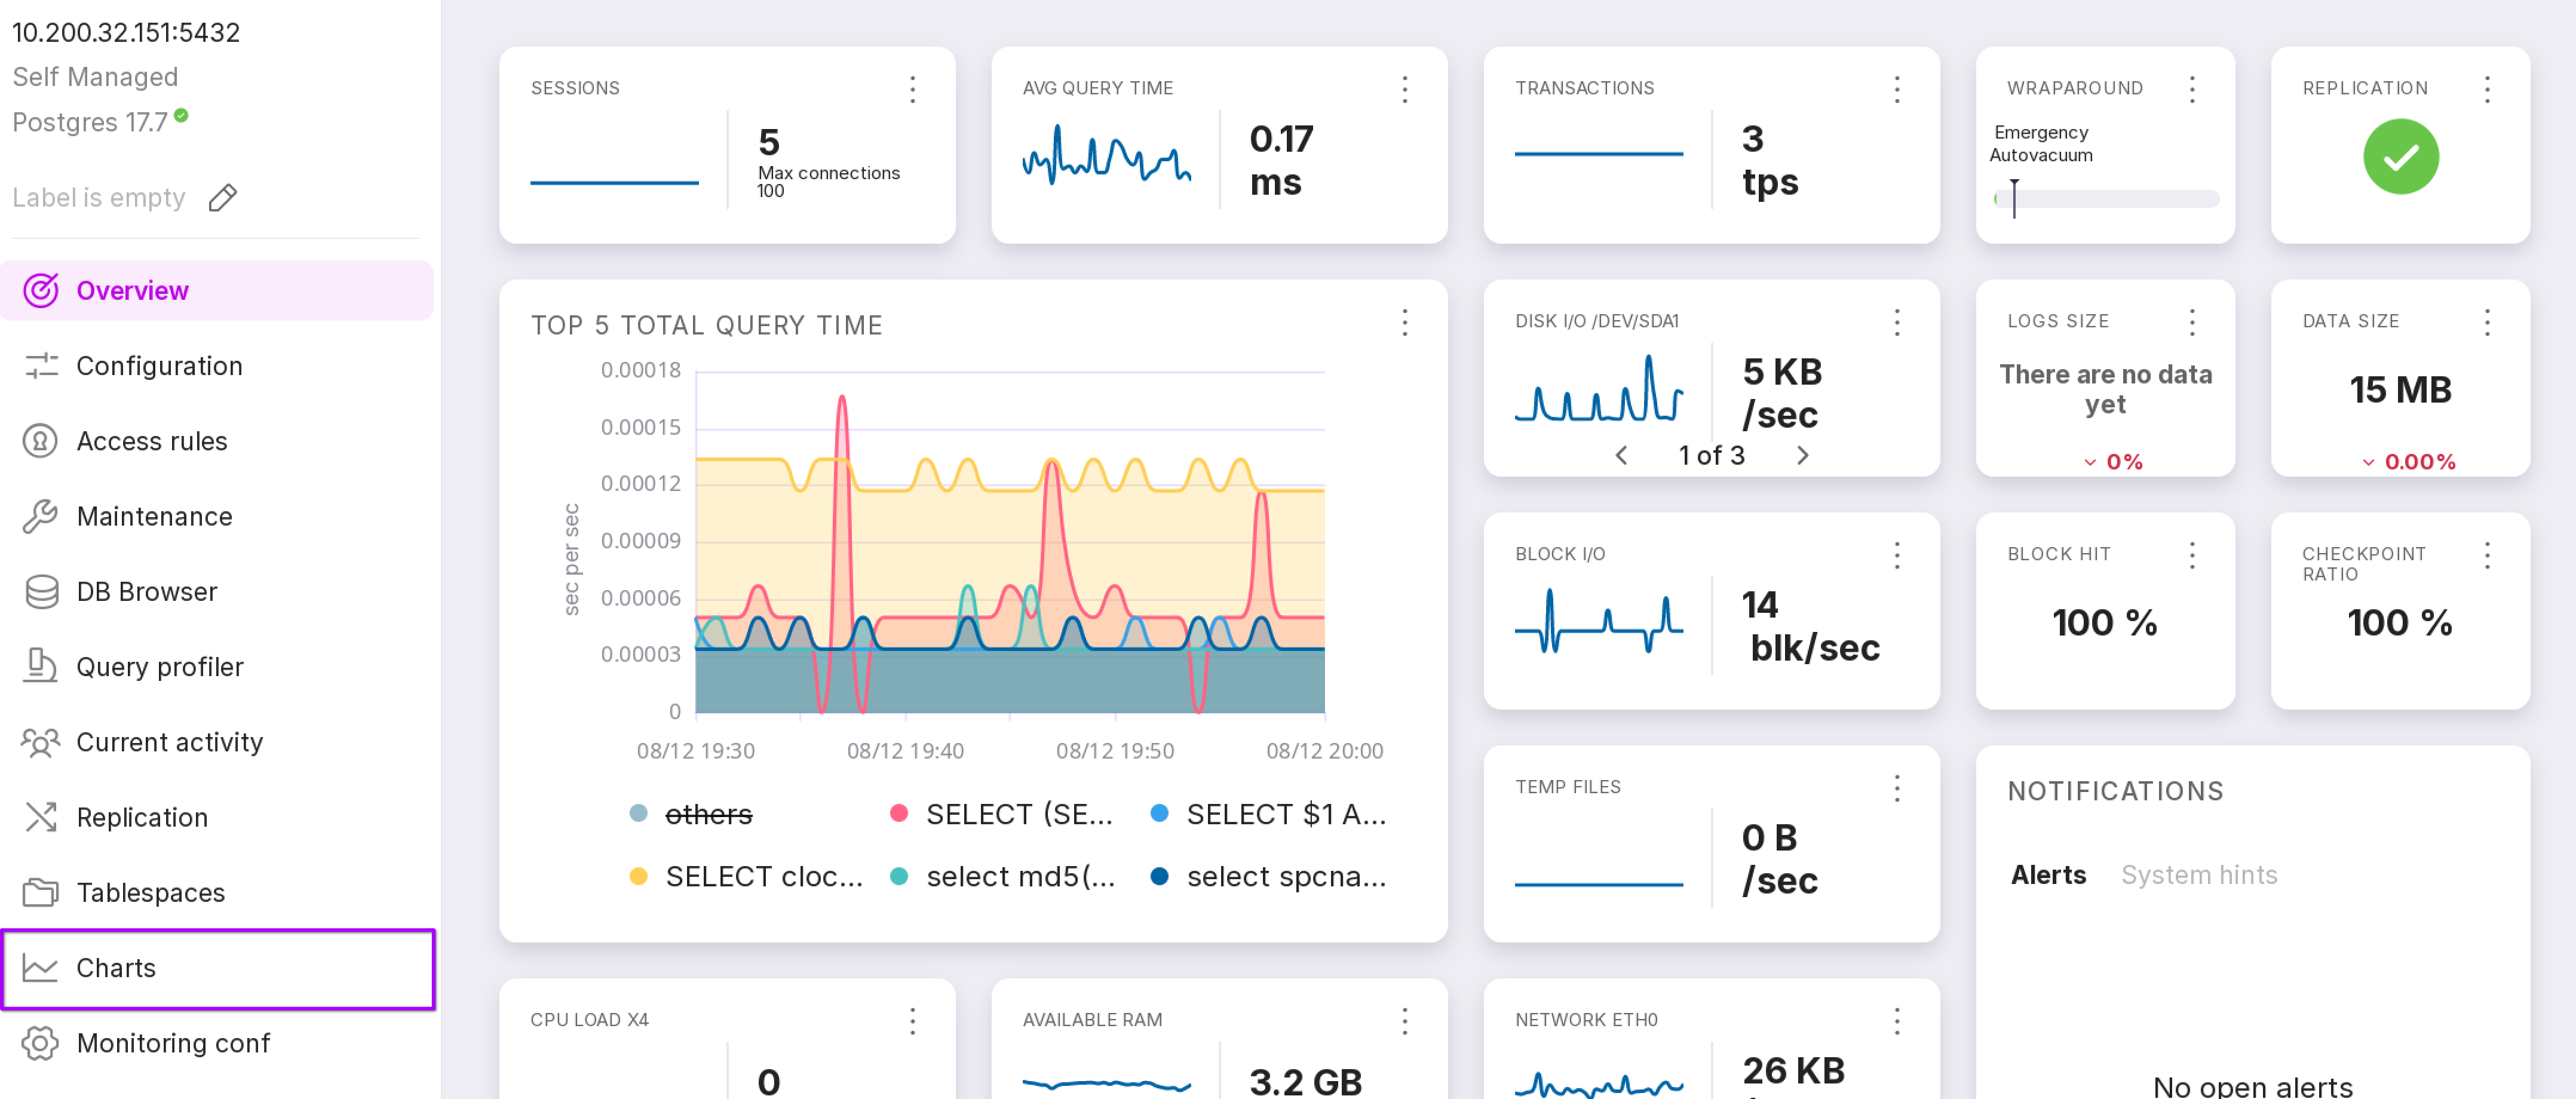
The “Charts” page displays charts and diagrams that enable visual monitoring of metrics related to the Platform, the DBMS, and the associated system hardware.
Upon your first visit to the page, you must configure which metrics to display.
Metric Selection
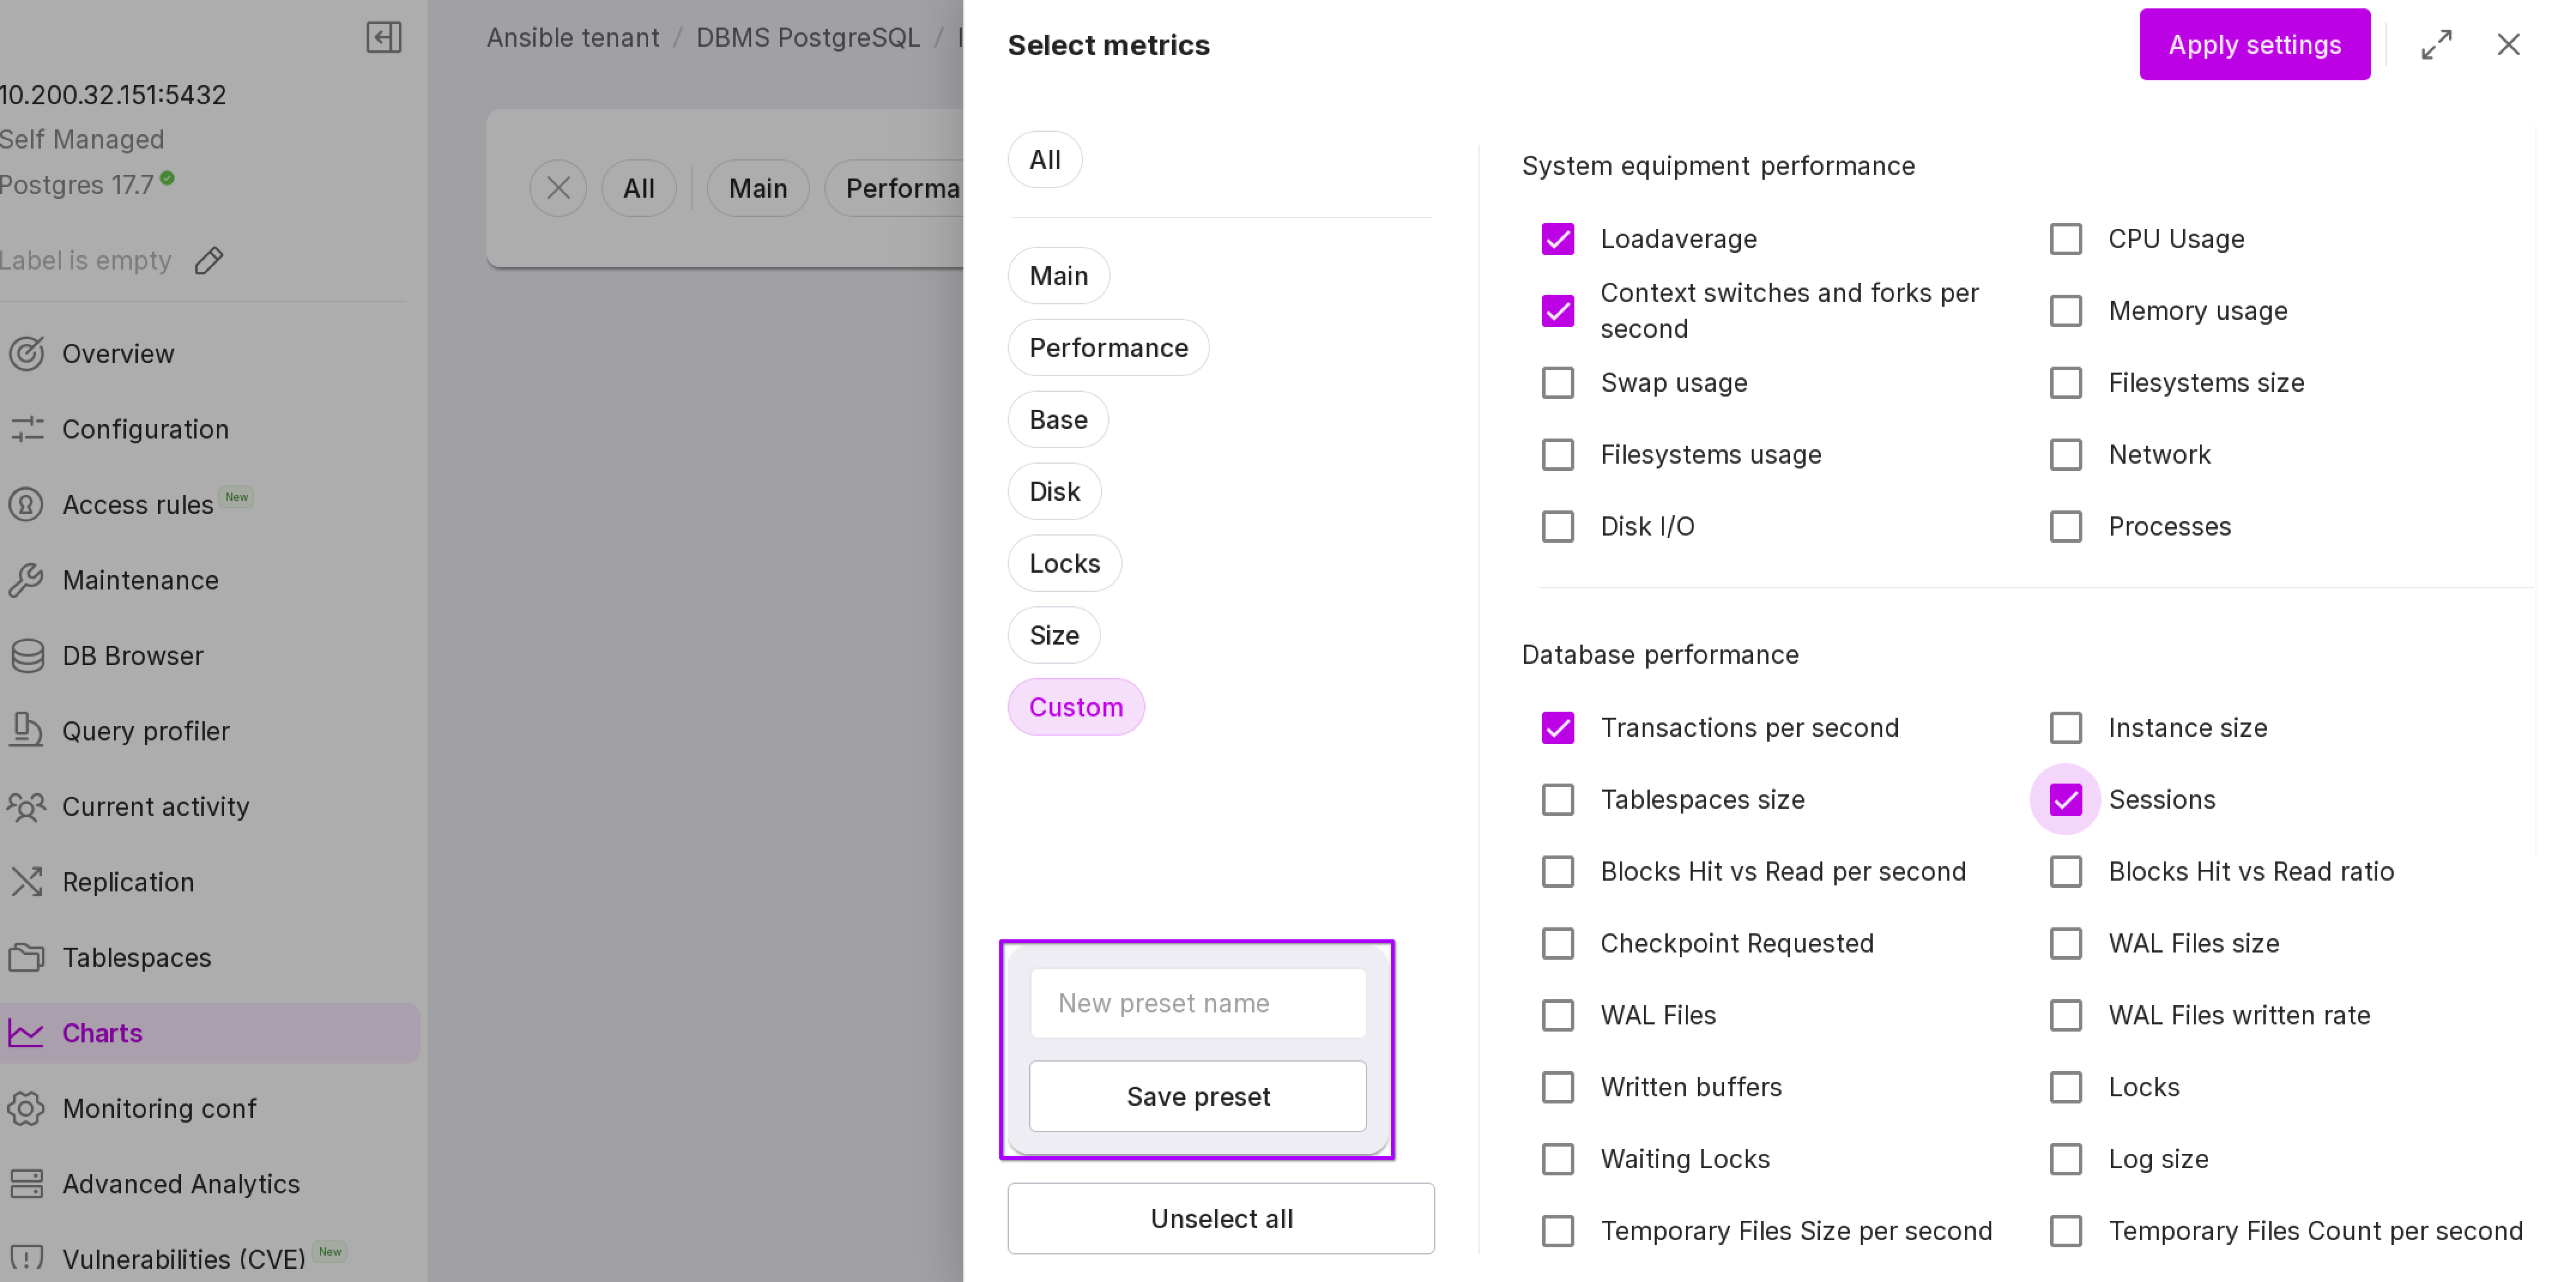
To configure metric display, you can either select one of the predefined sets or create a custom one:
“Predefined metric sets:”
All
System hardware performance metrics
“Load average”: average system load over a specified time period.
“Context switches and forks per second”: number of context switches and newly created processes per second.
“Swap usage”: utilization of swap (virtual) memory.
“Filesystems usage”: disk space usage across mounted filesystems.
“CPU Usage”: processor utilization.
“Memory usage”: physical RAM utilization.
“Filesystem size”: total size of filesystems.
“Network”: network connection utilization metrics.
“Disk I/O”: disk input/output activity metrics.
“Processes”: total number of processes and number of running processes.
DBMS performance metrics
“Transactions per second”: number of database transactions executed per second.
“Tablespaces size”: total size of PostgreSQL tablespaces.
“Checkpoints”: number of checkpoints performed.
“Blocks Hit vs Read ratio”: ratio of data retrieved from shared buffers versus data read from disk.
“WAL files”: number of ready Write-Ahead Logging (WAL) files.
“Written buffers”: statistics on buffers written to disk.
“Waiting Locks”: number of locks currently waiting to be acquired.
“Temporary Files Size”: total size of temporary files created by PostgreSQL.
“Autovacuum statistics”: statistics related to autovacuum operations.
“Tuples per second”: number of tuple (row) operations (inserts, updates, deletes) per second.
“Instance size”: total size of the database instance.
“Sessions”: number of active and idle database sessions.
“Blocks Hit vs Read per second”: per-second rate of buffer hits versus disk reads.
“WAL Files size”: total size of WAL files ready for archiving.
“WAL Files written rate”: rate at which WAL records are written.
“Locks”: total number of active locks.
“Log size”: size of PostgreSQL log files.
“Temporary Files Count”: number of temporary files created.
“PostgreSQL Availability”: indicator of PostgreSQL service availability.
“Deadlocks”: number of deadlock occurrences.
“Wraparound”: metrics related to transaction ID wraparound protection.
“Checksum failures and Conflicts”: number of data checksum errors and replication conflicts.
“Log file number”: count of log files.
“Total time avg”: average query execution time.
“Replication lag”: replication delay between primary and standby.
Platform operation metrics
“Agent state”: operational state of the database management agent.
Essential
Load average,
Context switches and forks per second,
Memory usage,
Filesystems usage,
Network,
Disk I/O,
Transactions per second,
Instance size,
WAL Files size,
WAL Files written rate,
Waiting Locks.
Performance
Load average,
CPU Usage,
Transactions per second,
Sessions.
Base
Transactions per second,
Tablespaces size,
Checkpoints,
Blocks Hit vs Read ratio,
WAL files,
Written buffers,
Waiting Locks,
Temporary Files Size,
Autovacuum statistics,
Tuples per second,
Instance size,
Sessions,
Blocks Hit vs Read per second,
WAL Files size,
WAL Files written rate,
Locks,
Log size,
Temporary Files Count,
PostgreSQL Availability,
Deadlocks,
Wraparound,
Checksum failures and Conflicts,
Log file number,
Total time avg,
Replication lag.
Disk
Swap usage,
Filesystems size,
Filesystems usage,
Disk I/O,
WAL Files size,
WAL Files,
WAL Files written rate,
Temporary Files Size per second,
Temporary Files Count per second.
Locks
Sessions,
Locks,
Waiting Locks.
Size
Filesystems size,
Instance size,
Tablespaces size,
WAL Files size.
To create a custom metric set, click the “+ Preset” button. In the dialog winwow, select the required metrics, enter a name for your new set, and click “Save Preset”.
After selecting a metric set, click “Apply Settings”. The “Charts” page will open, displaying charts for the selected metrics.