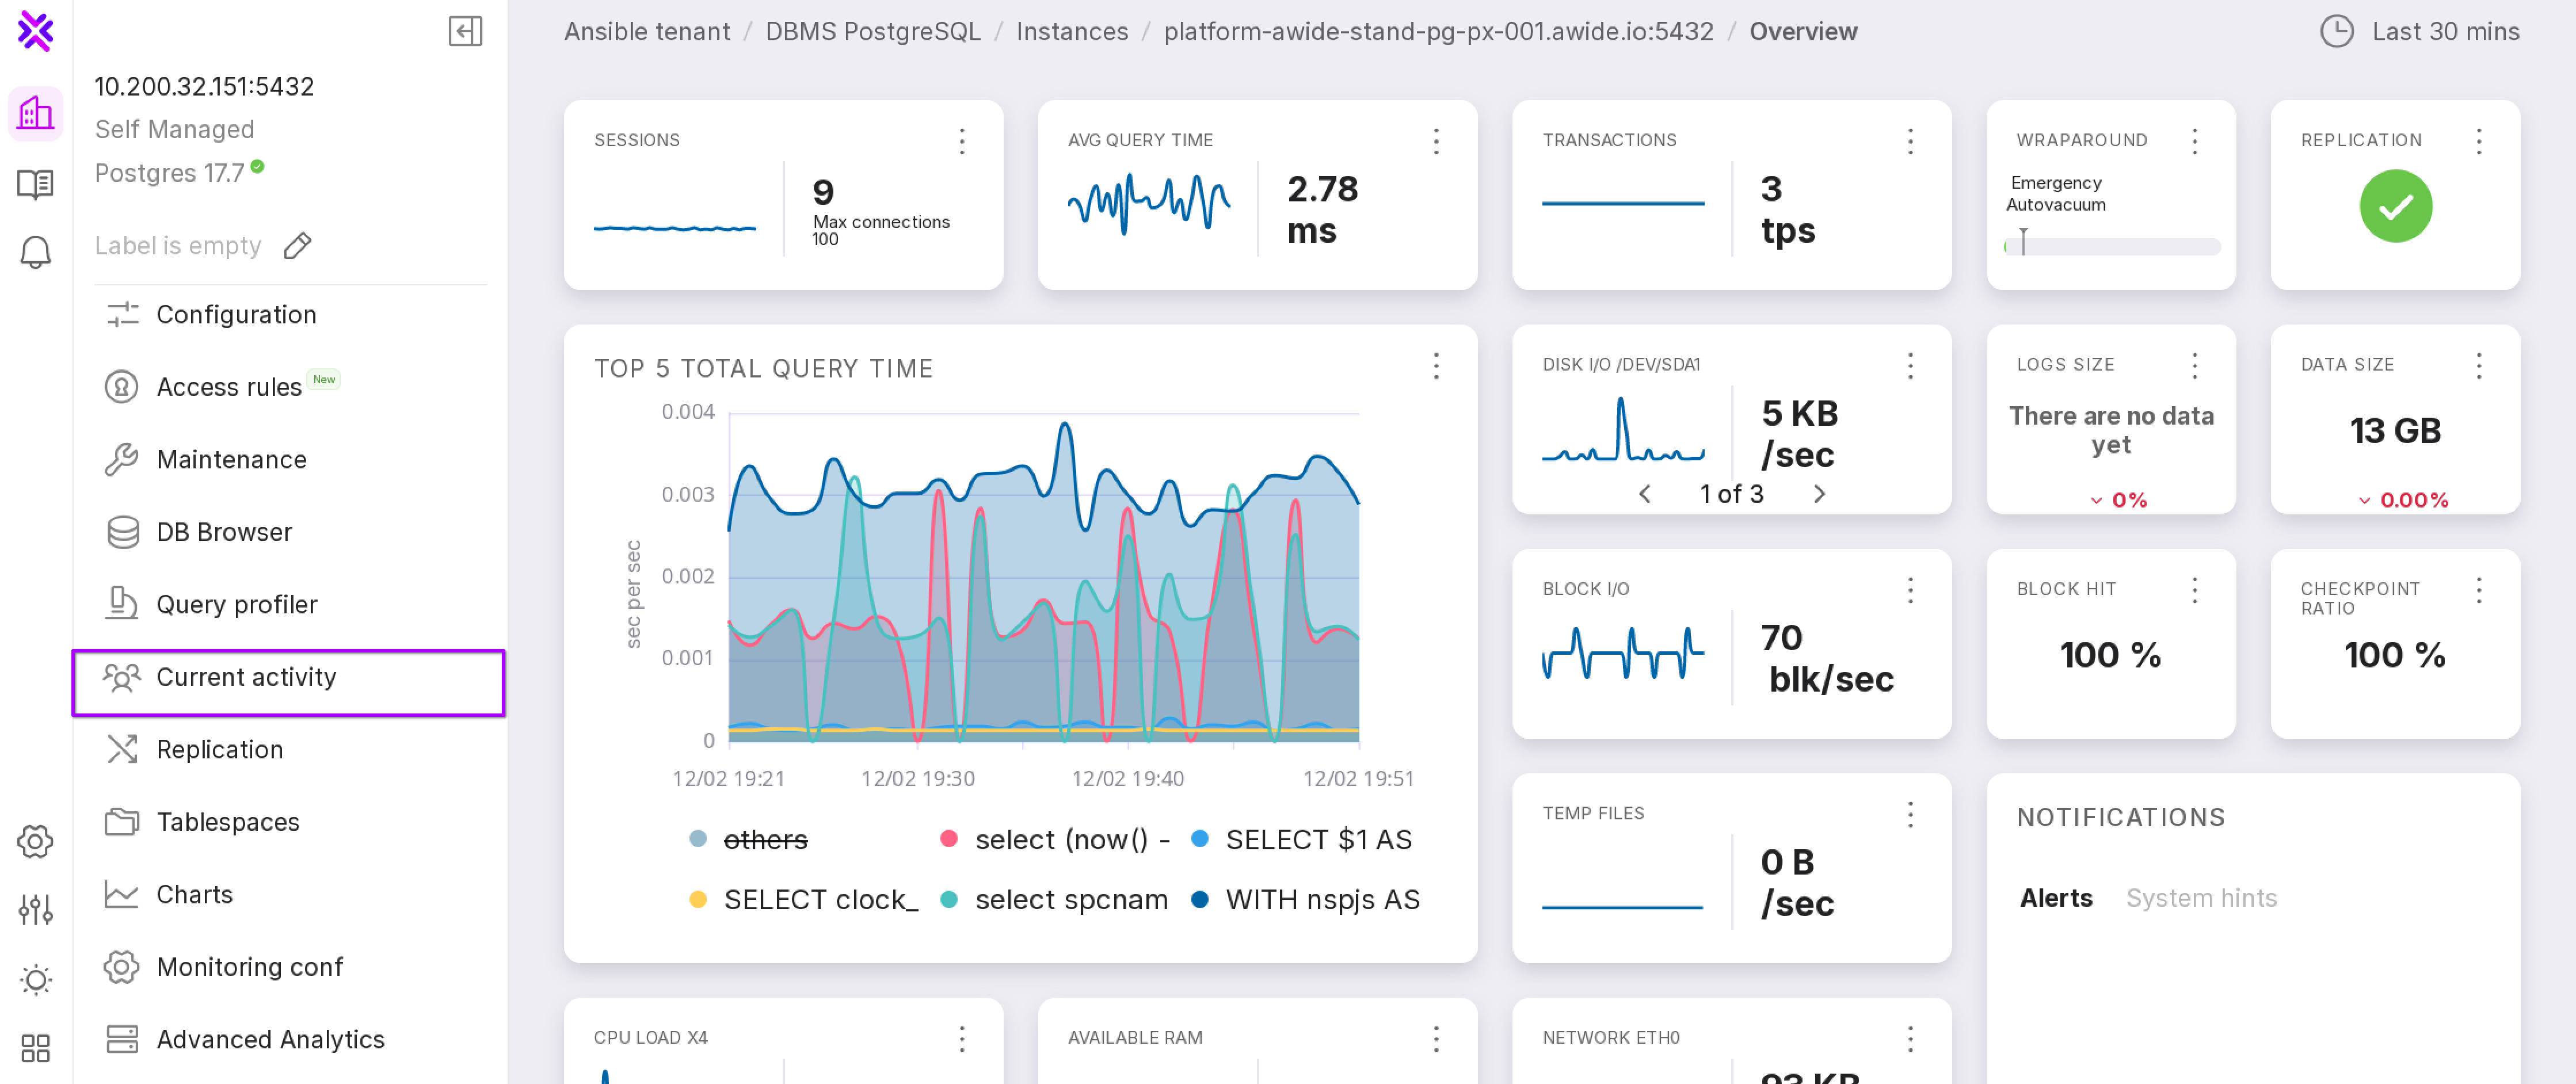
Current Activity
To navigate to this page, click on “Current Activity” in the left menu panel of the instance.
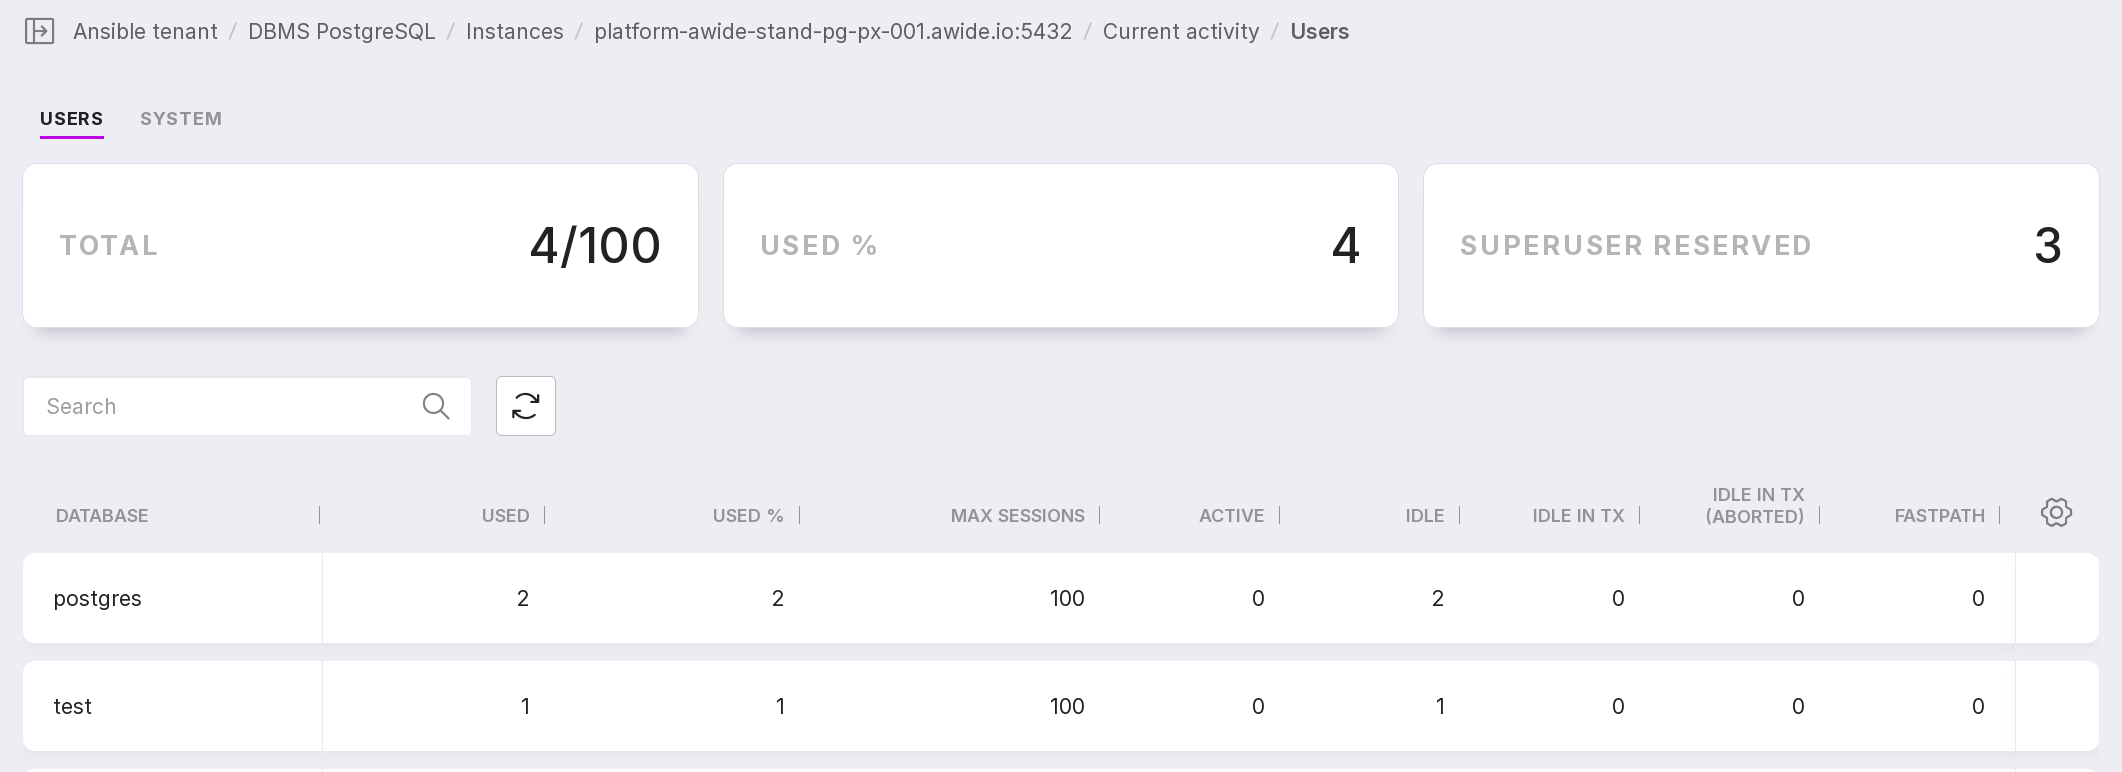
The “Current Activity” page displays information for two groups of processes:
Users;
System.
For each group, aggregated values are calculated in absolute and relative terms. The information on the “Current Activity” page is collected on-demand and updates every five seconds.
Users Tab
On the “Users” tab, information is presented in a table that aggregates user session data for each database in the instance.
You can customize the appearance of the table yourself. To change the set and arrangement of columns, click the gear icon.
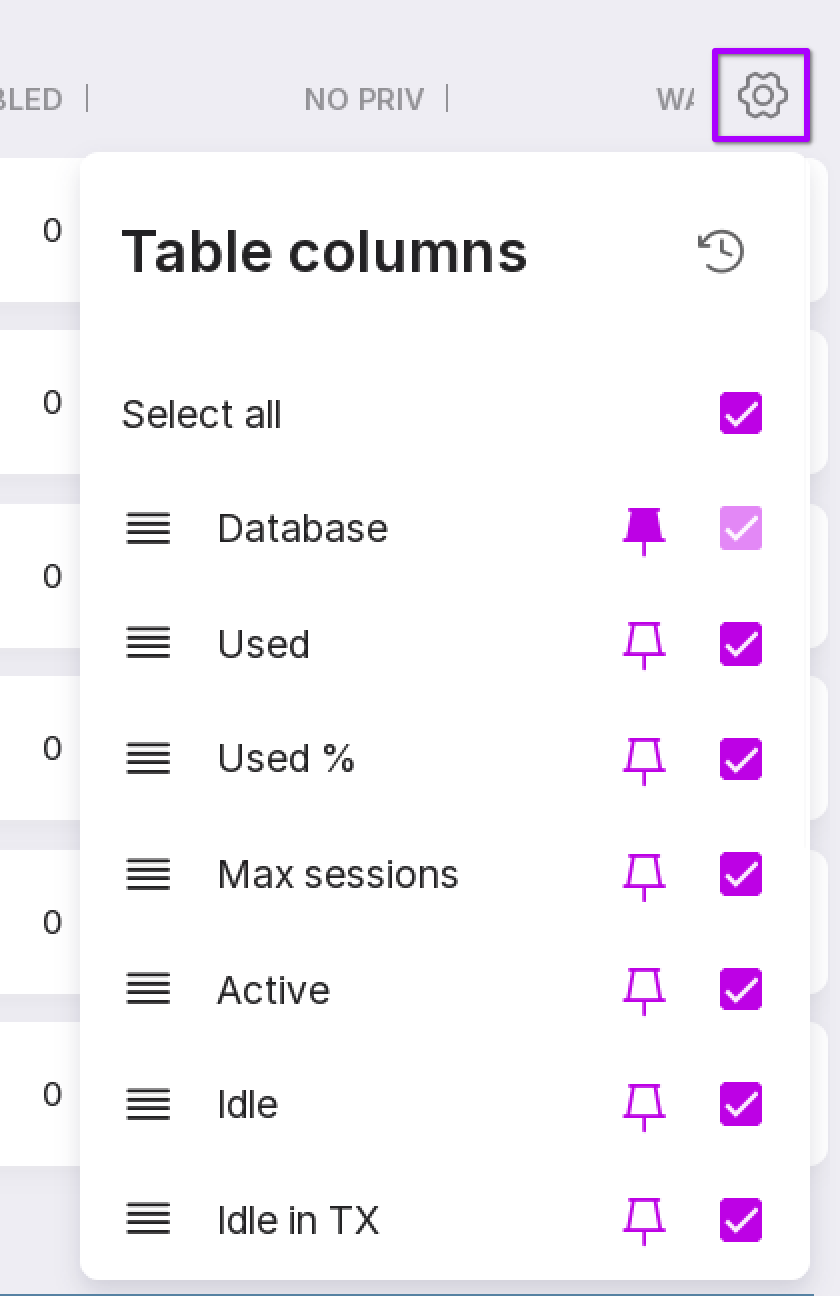
This button can be used to change the position of columns in the table.
Click the button icon to pin a column in the table.
Check the checkboxes of the columns that you want to display in the table.
Clicking on a row with one of the databases will open a page with three tabs:
Running,
Waiting,
Blocked.
You can read more about these tabs in the next sections.
Users → Running
On the “Running” tab, all current user sessions are displayed.
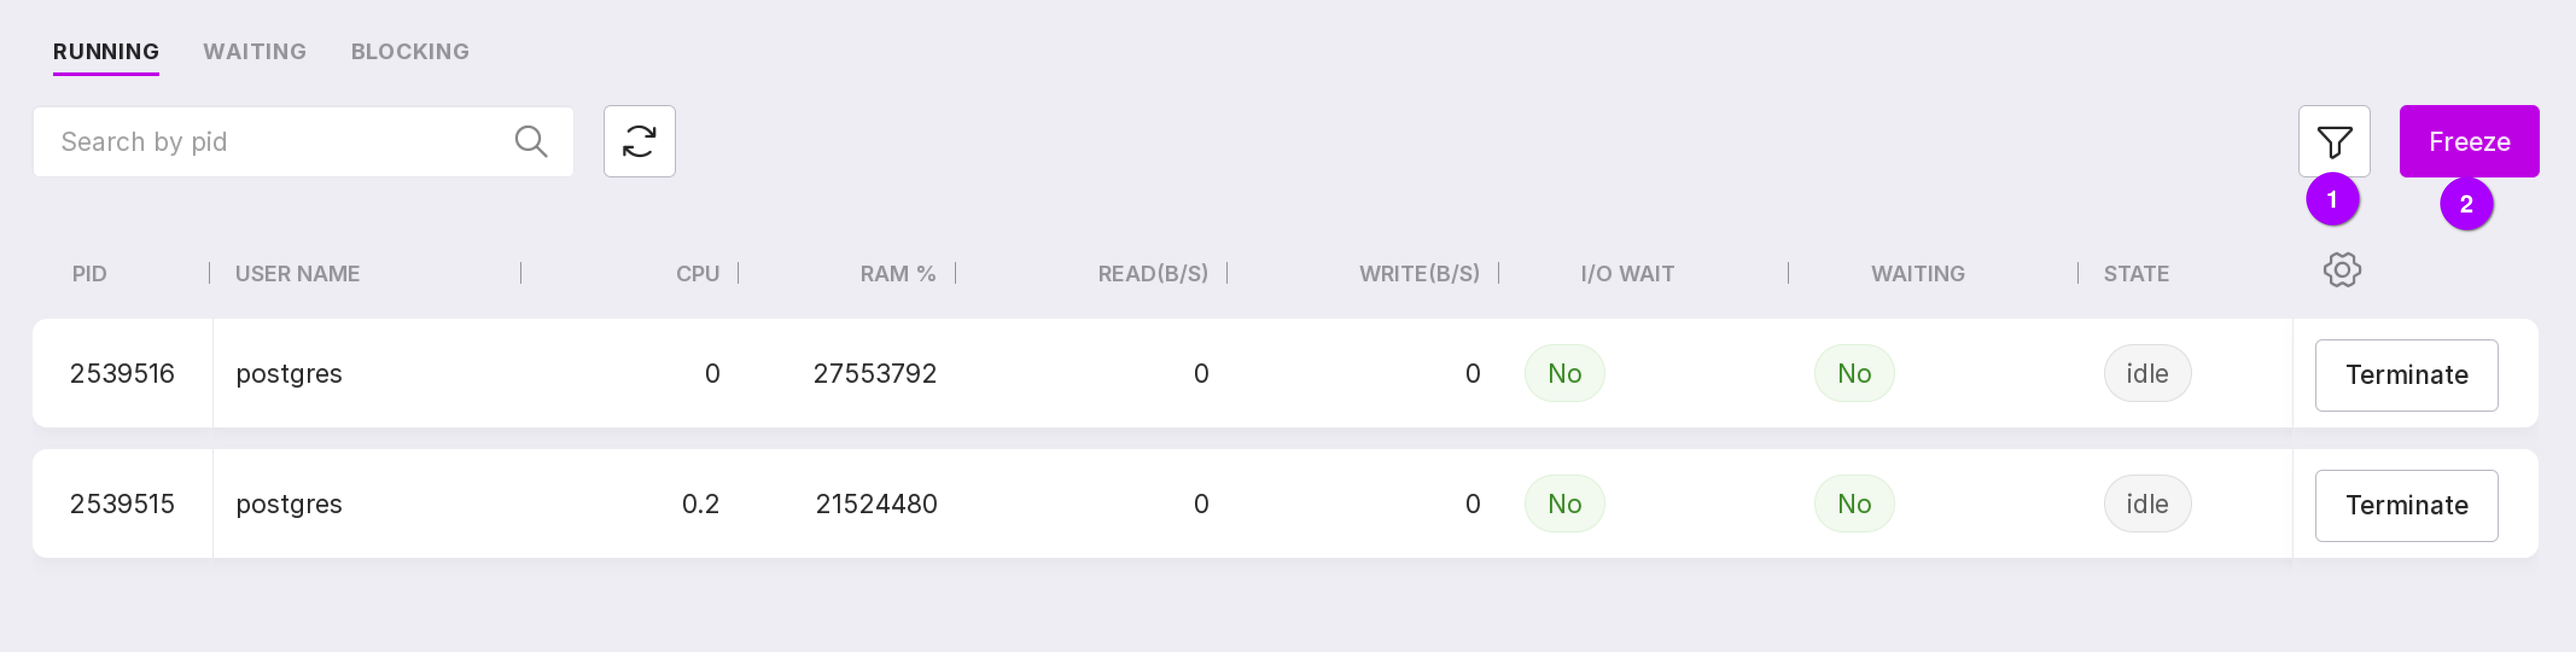
Table customization button allows you to configure the table’s appearance and visible columns.
The “Terminate” button executes pg_terminate_backend(<process PID>).
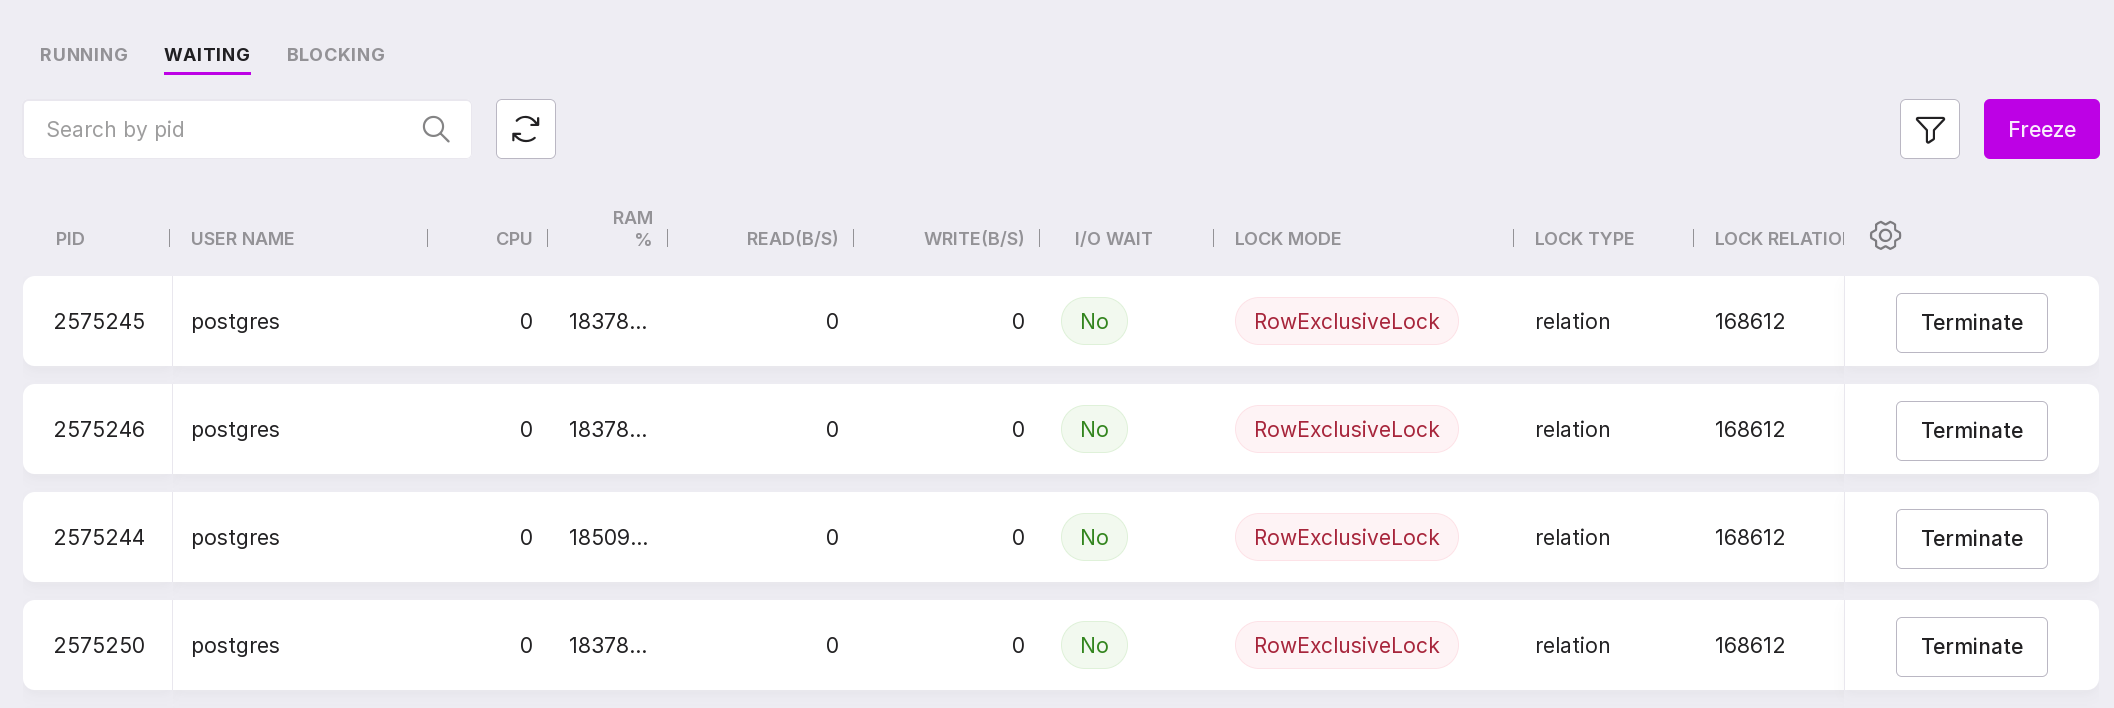
Users → Waiting
On the “Waiting” tab you see all current user sessions where the “State” is “Waiting”.
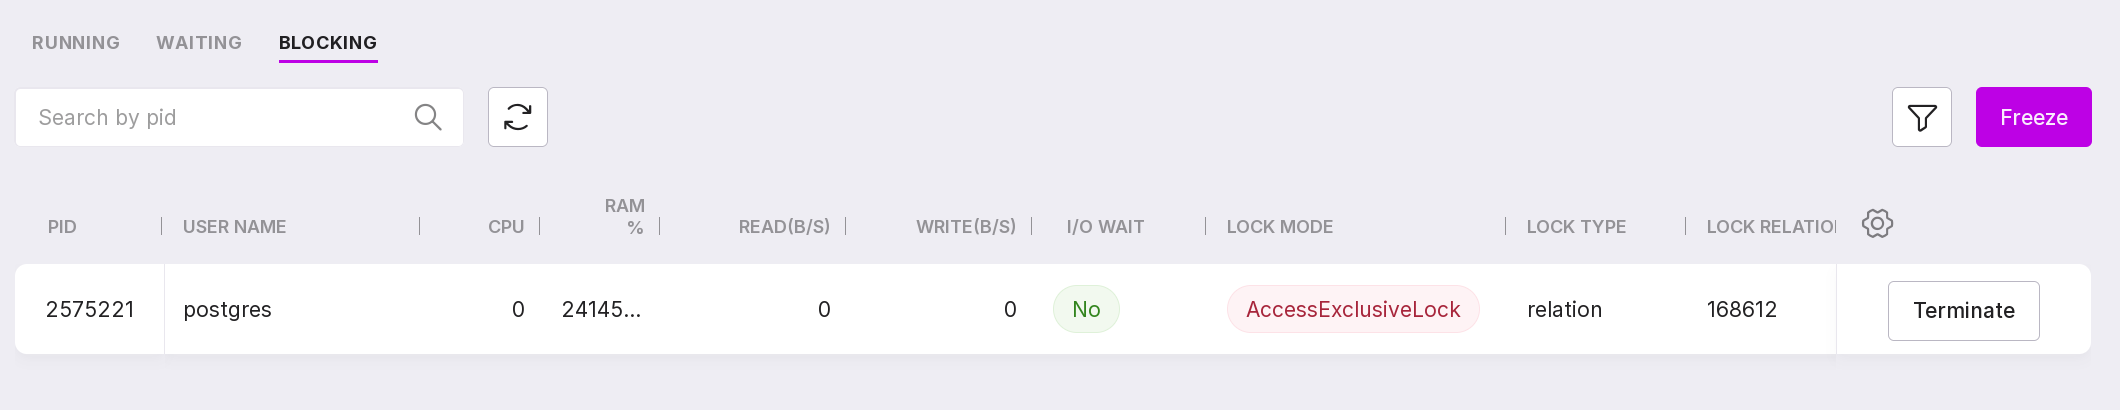
Users → Blocked
On the “Blocked” tab, all current user sessions with locks are displayed.
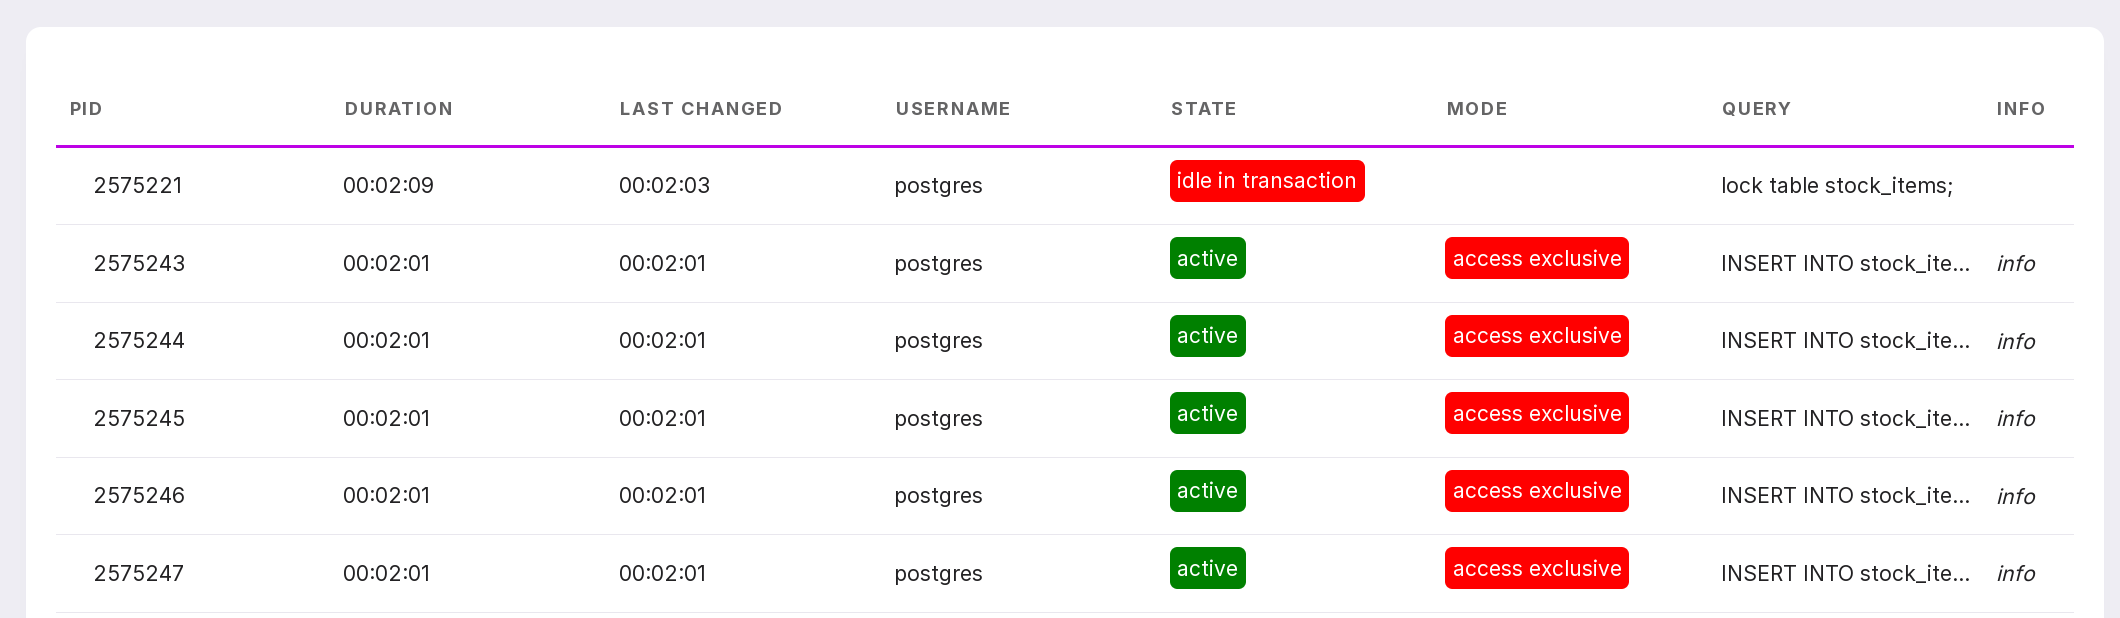
Locks can be viewed in tree mode. This allows understanding which transaction (process) blocks other transactions (processes).
Locks can be viewed in tree mode, which helps you identify which transaction (process) is blocking other transactions (processes). To do this, click on the row corresponding to the required process:
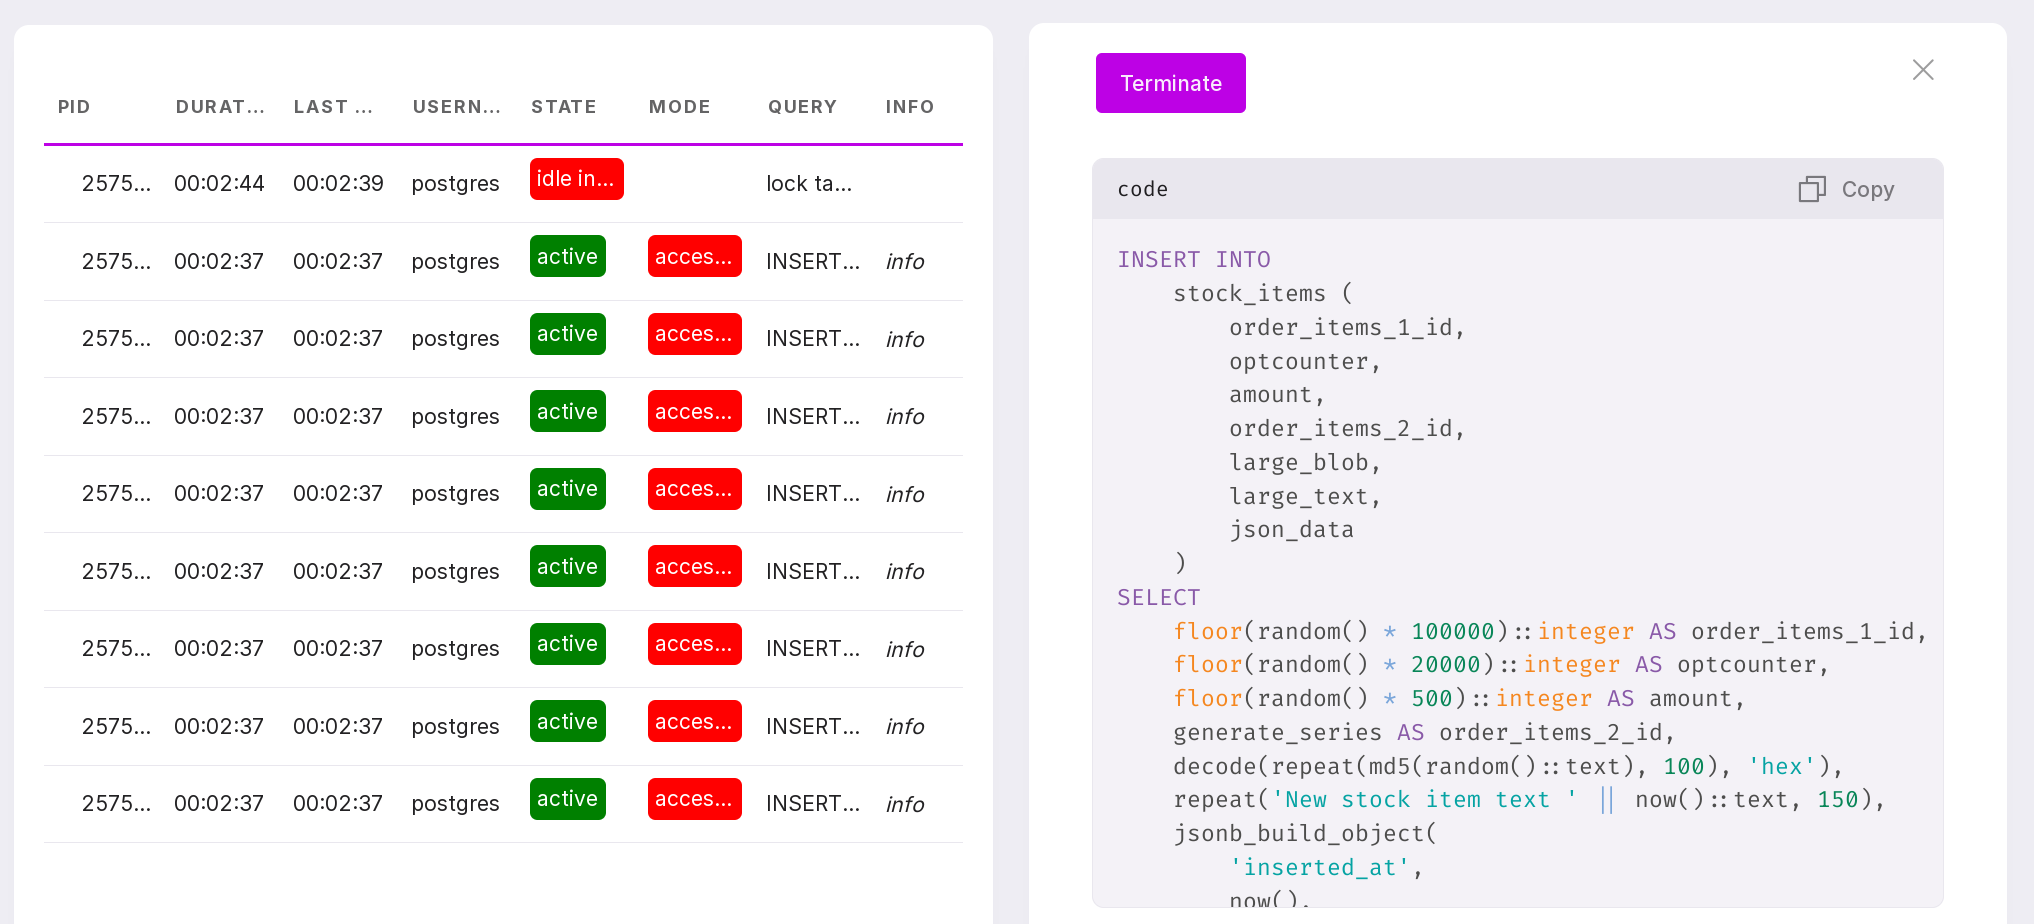
To terminate the process, go to its page. To do this, click on the process line. In the opened window, click “Terminate”. View-only users cannot terminate the process.
The “System” tab
On the “System” tab, information is presented in a table that aggregates the system processes data for the PostgreSQL instance or for each of the databases in the instance.
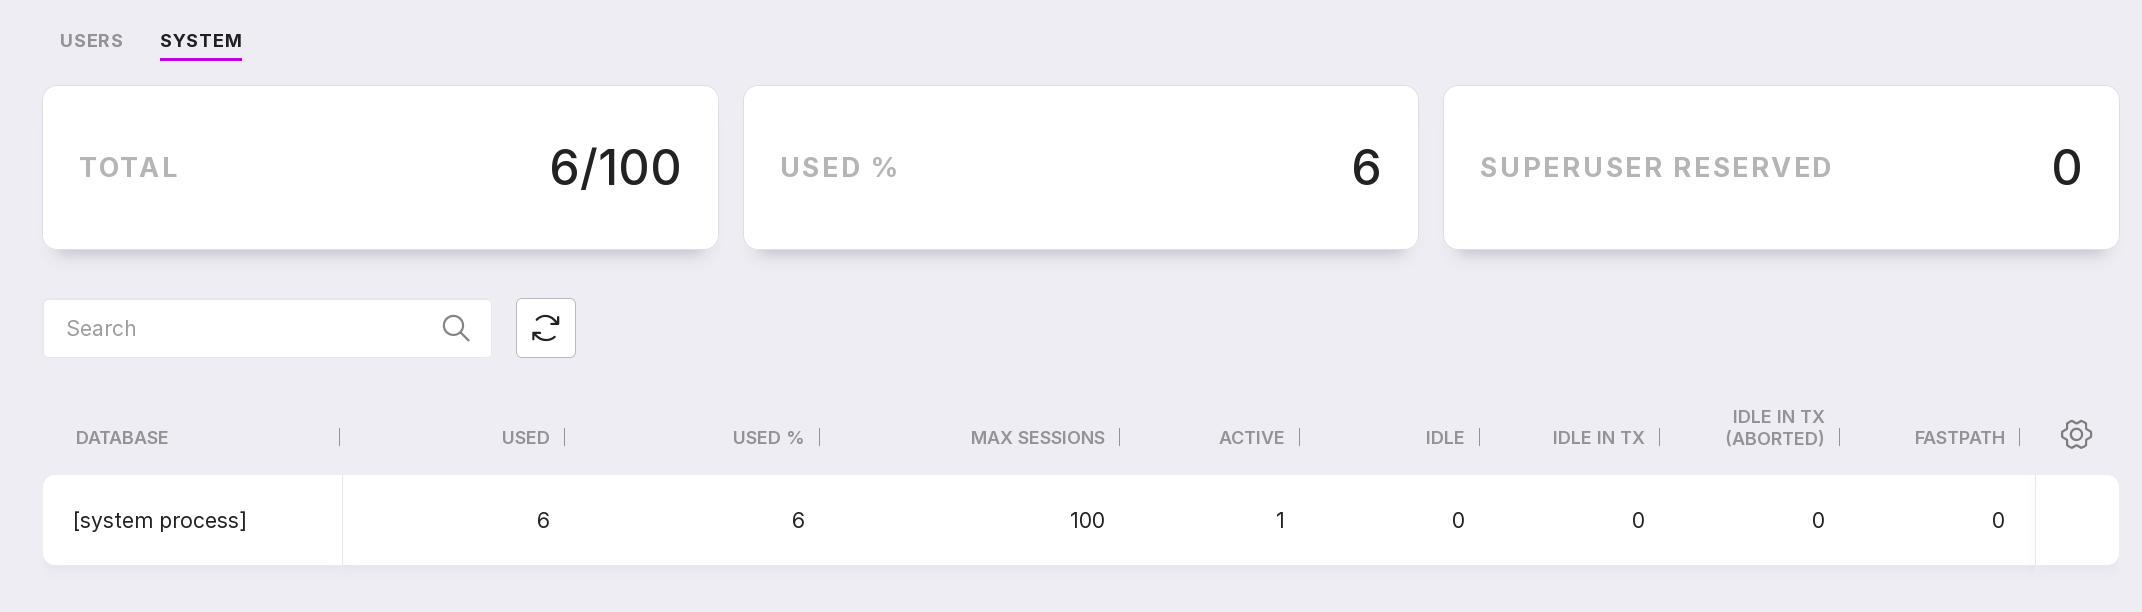
Such processes include:
autovacuum launcher,
scheduler,
logical replication launcher,
background writer,
checkpointer,
walwriter,
extension processes, for example, pg_cron.
Click on a database row to navigate to the list of processes.
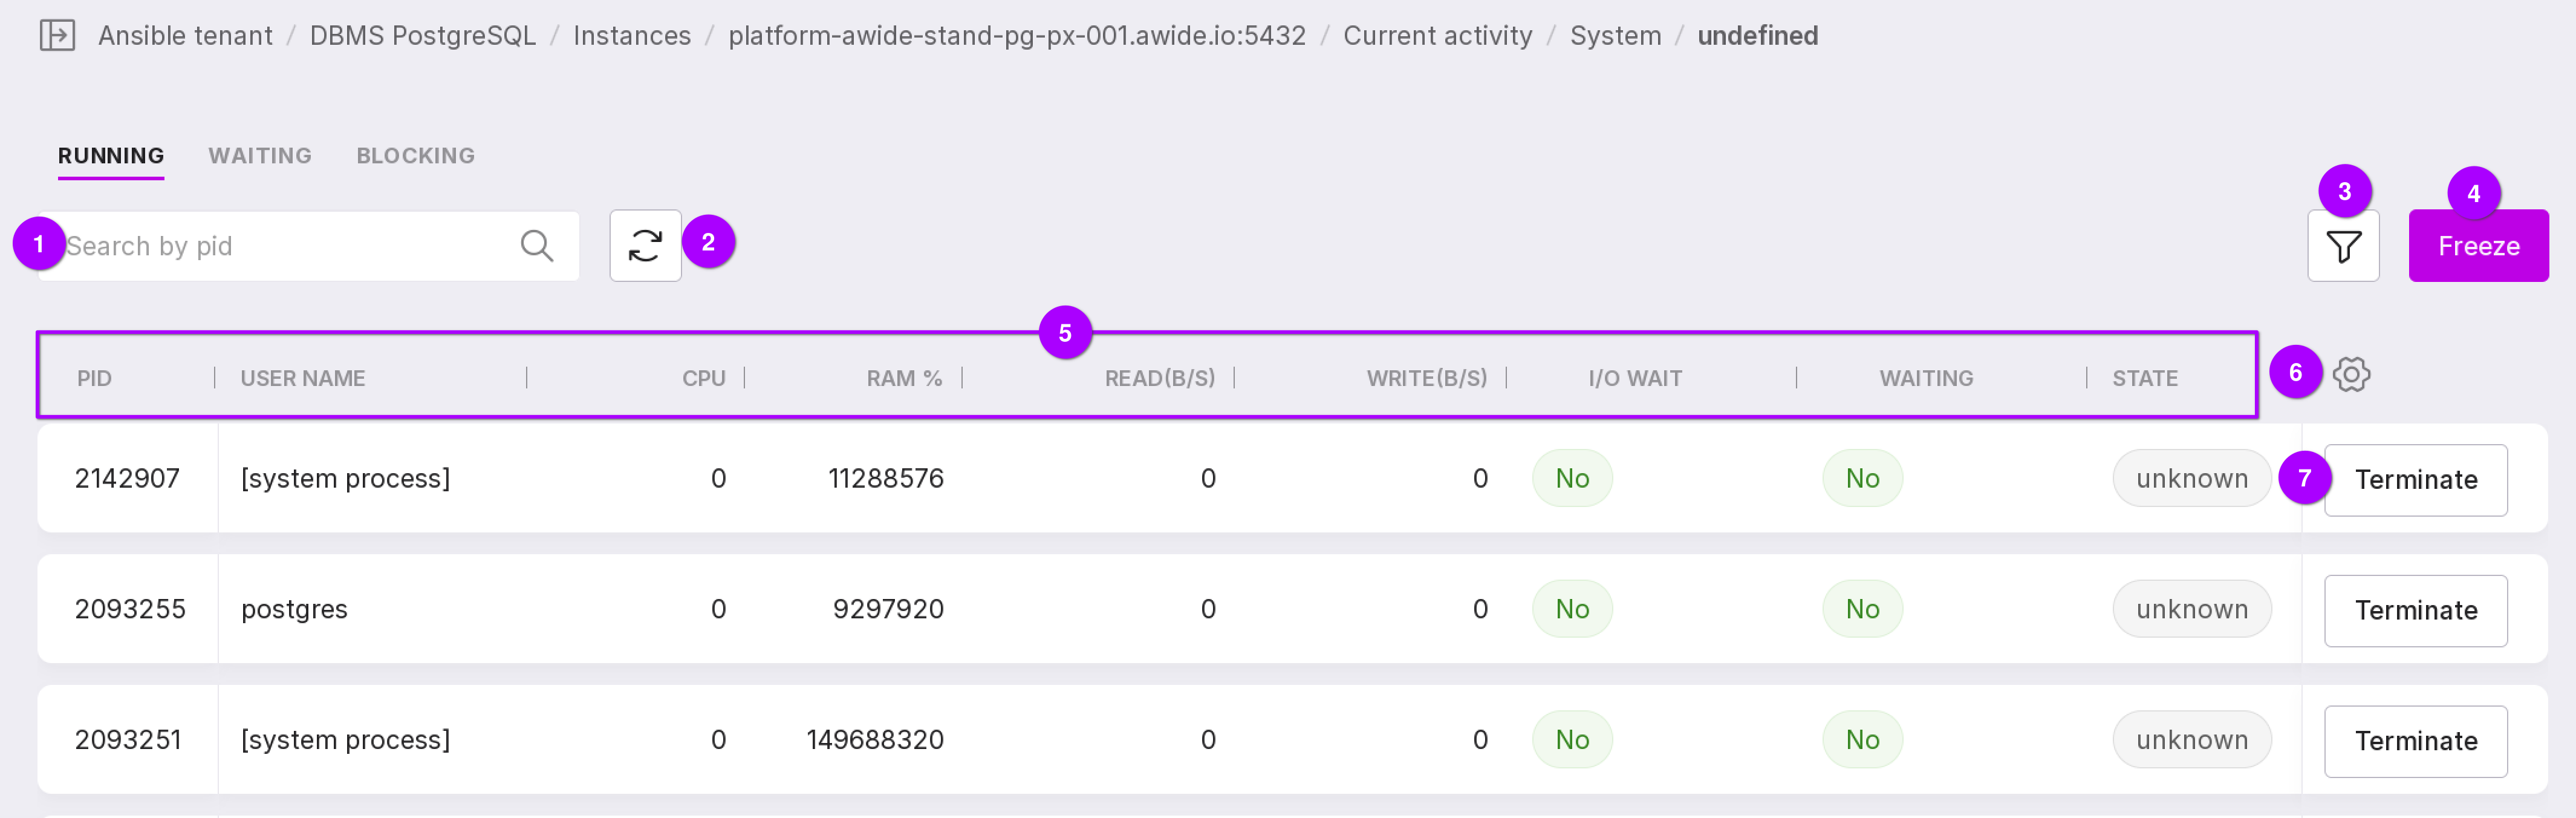
Search field — allows you to search for processes by PID.
Refresh page button — reloads the current data.
Filter by the “State” and “I/O Wait” columns.
The Freeze button pauses automatic table updates.
Process (session) details:
“PID” — process PID;
“Username” — the user who started the process;
“CPU” — CPU utilization in percentage;
“RAM %” — RAM utilization in percentage;
“Read (B/S)” — read speed (bytes per second);
“Write (B/S)” — write speed (bytes per second);
“I/O Wait” — input/output wait;
“Waiting” — process wait;
“State” — the state in which the process is located;
“Duration” — time since the process started;
“Query” — query text.
Table customization button allows you to configure the table’s appearance and visible columns.
The “Terminate” button executes pg_terminate_backend(<process PID>).