Clusters Tab on the Namespace Page
The “Clusters” tab displays all clusters in the namespace along with key parameters for each cluster:
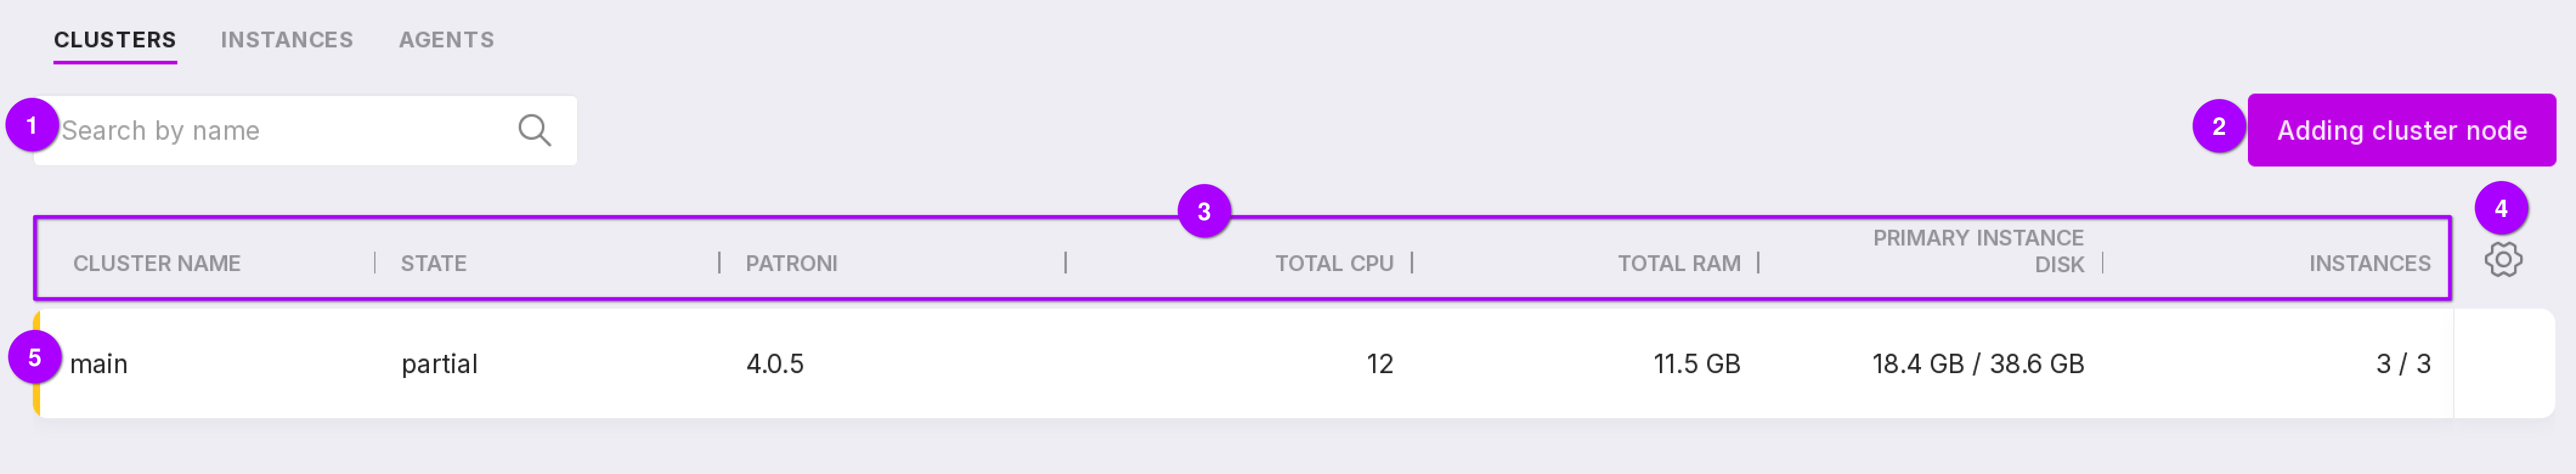
“Search field” — allows you to search for clusters by name.
“Add cluster node” button — opens the Add New Cluster Instance dialog.
Cluster information:
“Cluster Name” — the cluster’s display name;
“State” — current operational state of the cluster;
“Patroni” — Patroni version in use;
“Total CPU” — total number of logical CPU cores available across all nodes in the Patroni cluster;
“Total RAM” — total amount of physical memory available across the entire Patroni cluster;
“Primary Instance Disk” — used/total disk space on the PostgreSQL leader/primary instance;
“Instances” — total number of instances in the cluster.
“Table customization button” — allows you to configure the visible columns and appearance of the table.
Cluster state color indicators:
“Green” — cluster is running without errors;
“Yellow” — asynchronous replica is running, or other nodes are down;
“Red” — primary node is down, or asynchronous replica is not running;
“Purple” — cluster is under maintenance.