Alerts
On this page, you can view the list of alerts and detailed information on them.
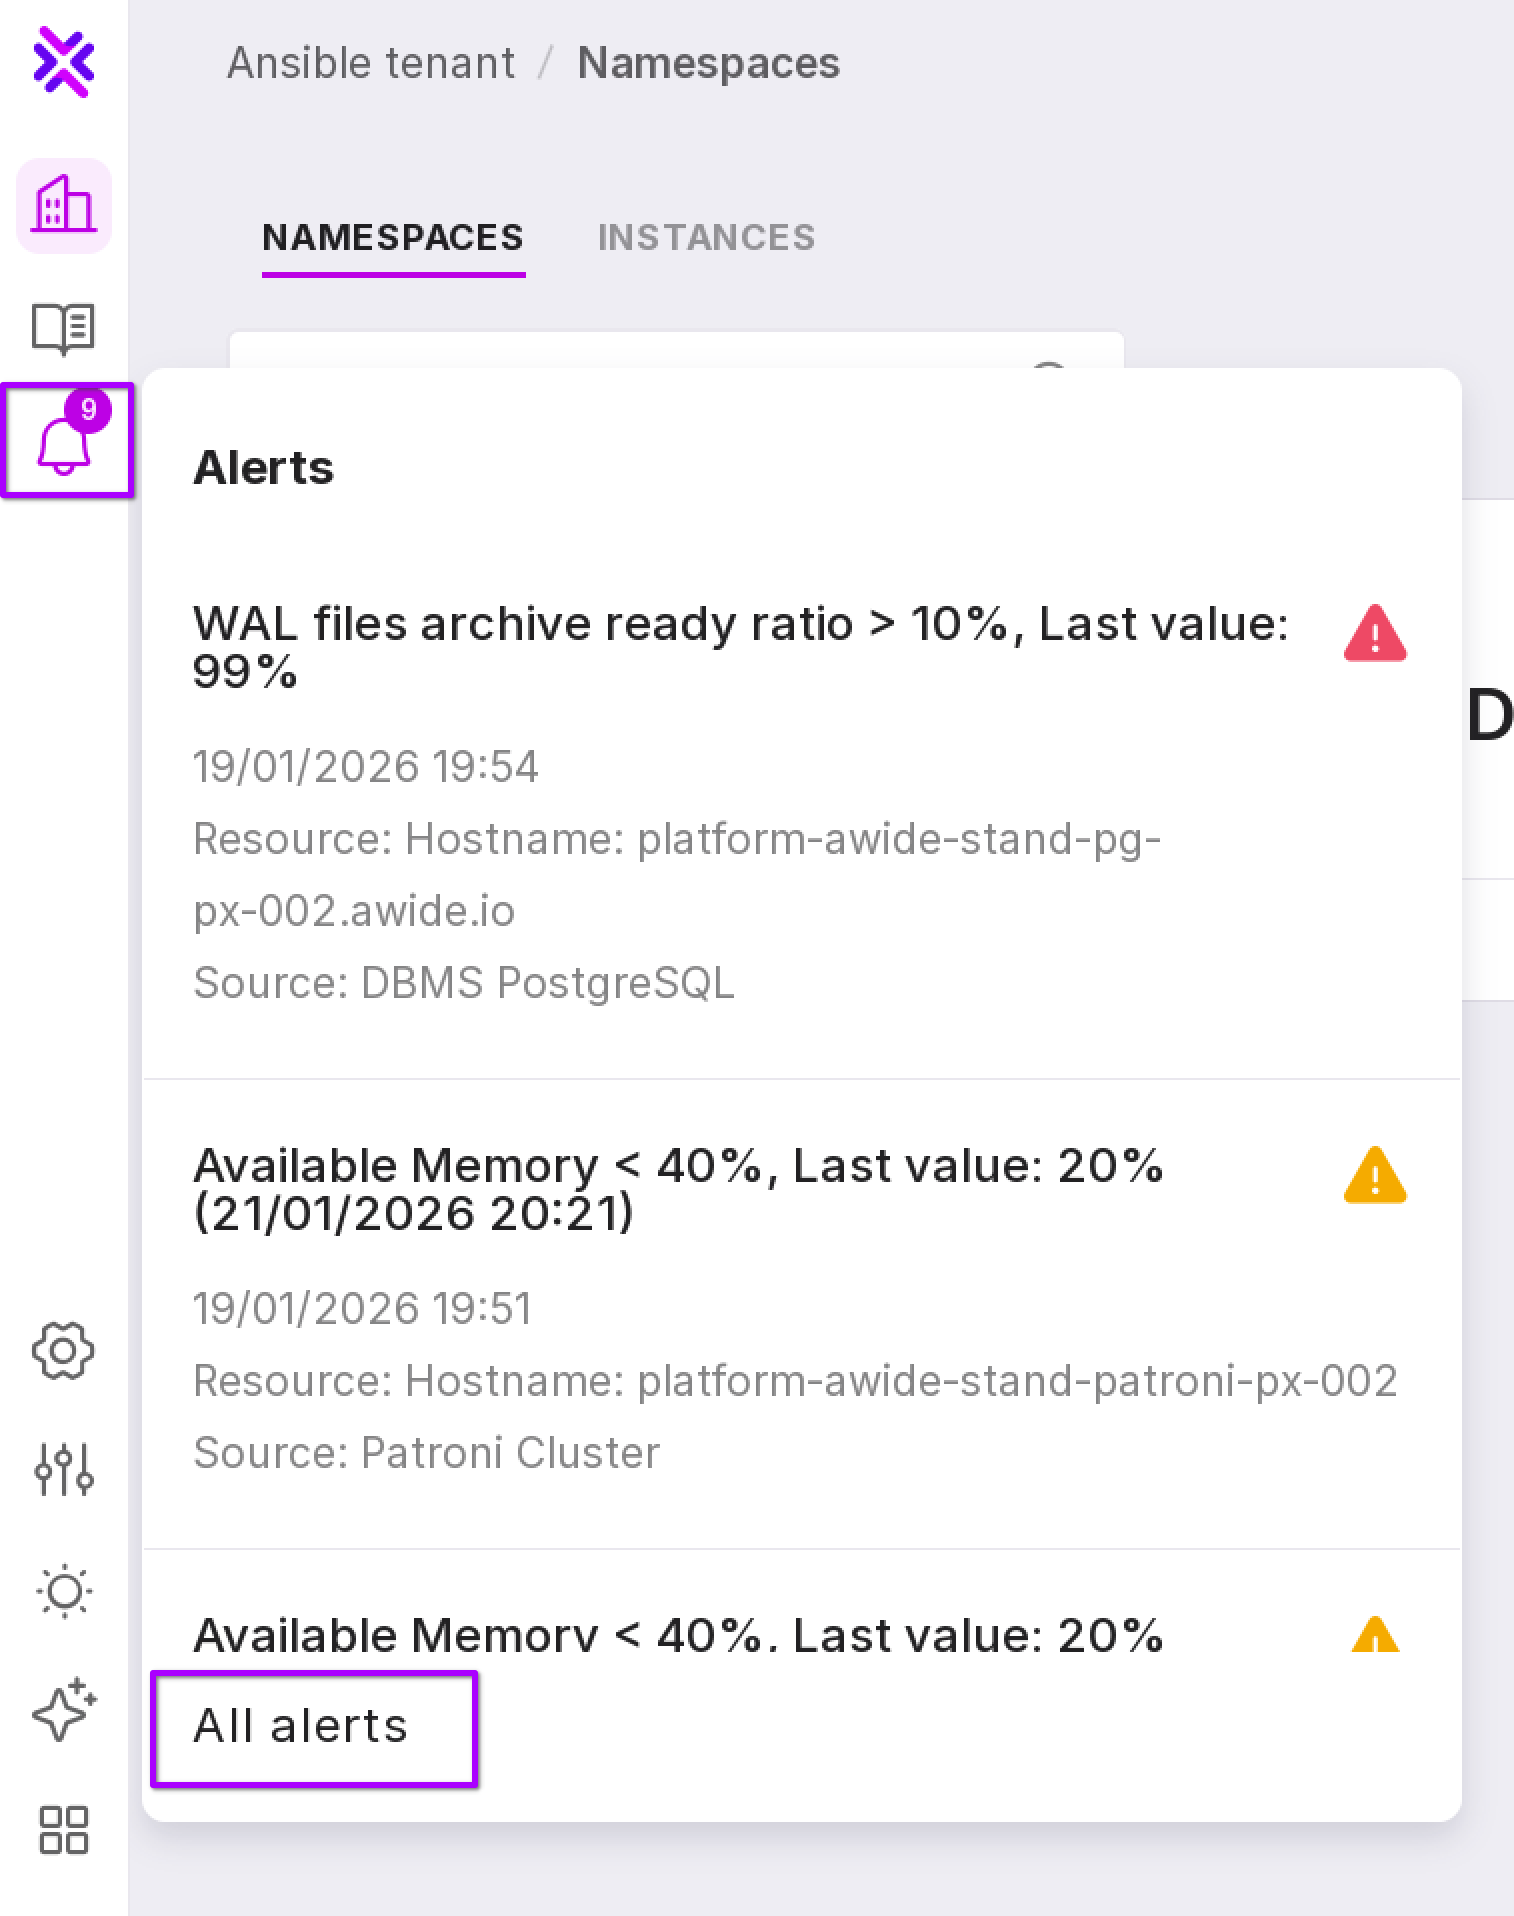
You can open the “Alerts” page in one of the following ways:
click on the alerts icon on Platform control panel → “View all messages”;
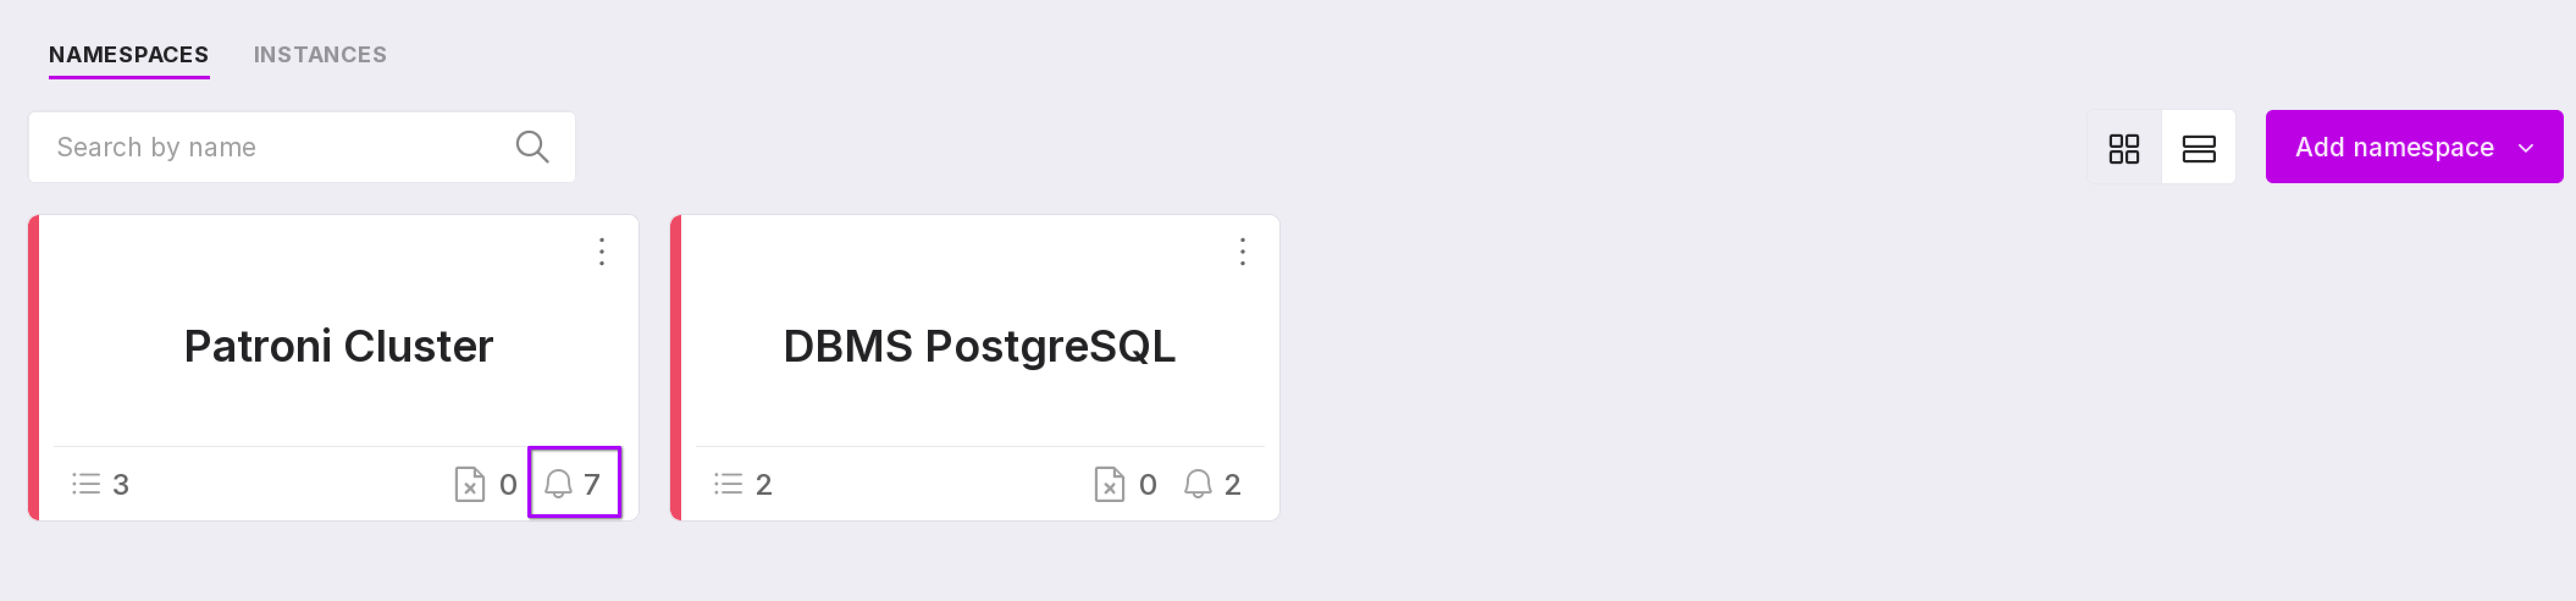
click on the alerts icon in the namespace;
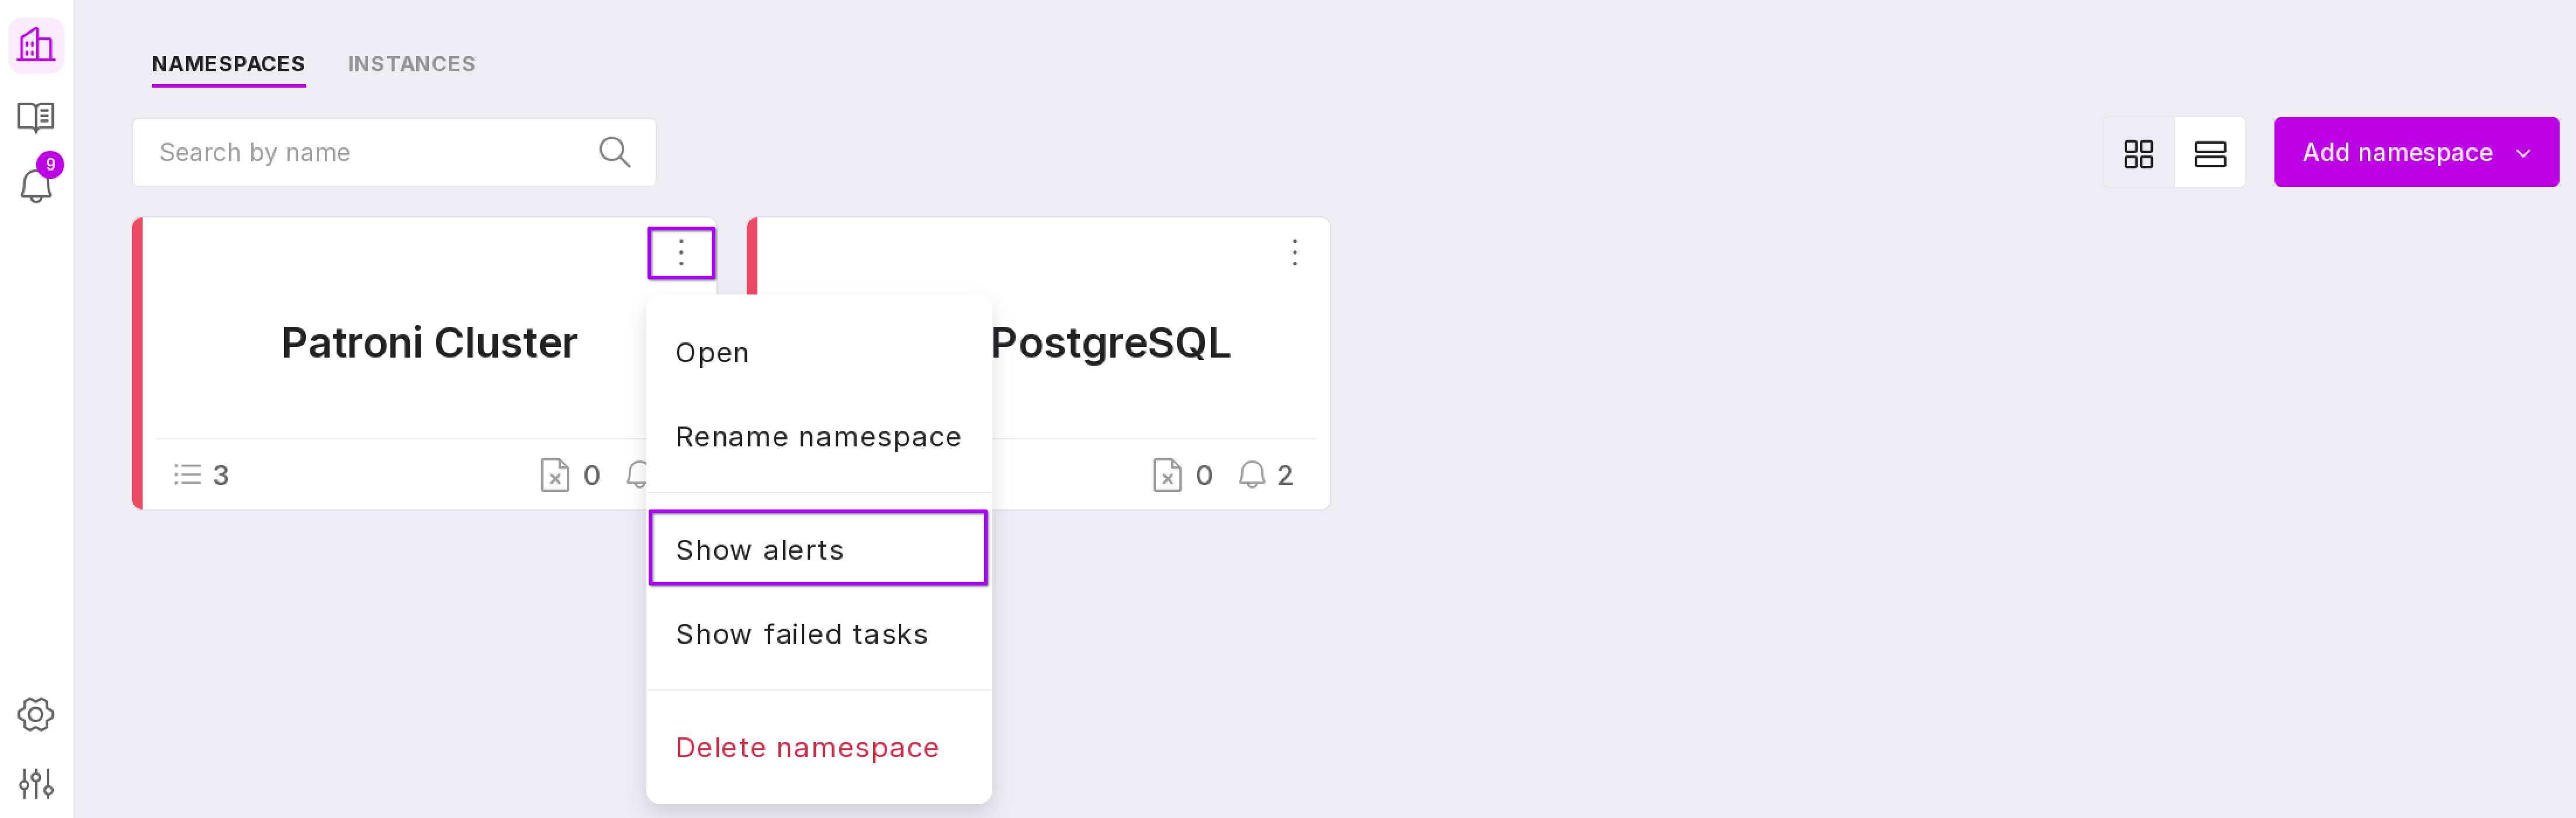
select the “Show Alerts” option in the namespace menu.
List of Alerts
Alerts are presented in a table with the following information:
ID;
Triggered at — the date and time the alert was created;
Namespace to which the alert relates;
Resource;
Severity with color coding:
Red — Problem;
Yellow — Warning.
Trigger;
Status.
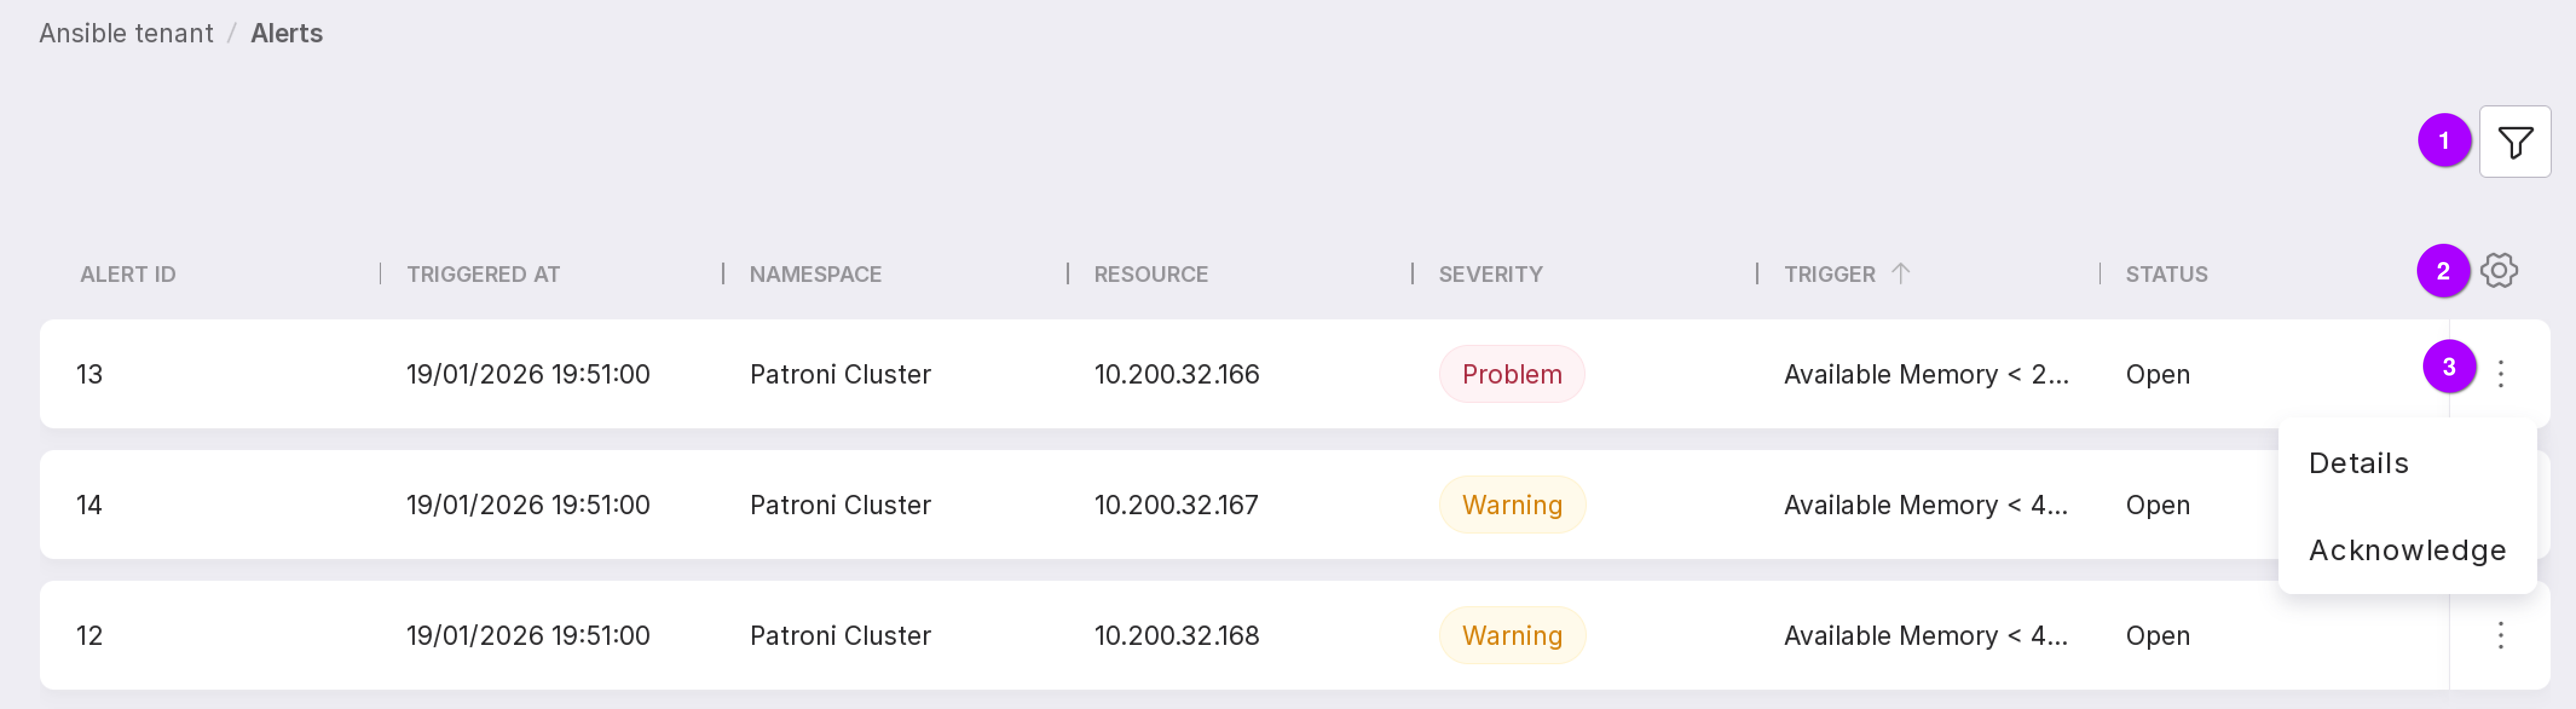
Let’s review the functionality of the page, as numbered in the figure above:
Alerts can be filtered by the following parameters:
namespace;
severity:
Warning,
Problem
Undefined,
OK.
status:
Open;
Closed — manually acknowledged;
Closed — auto recovered.
time interval:
Last 7 days,
Last 30 days,
Last 6 months,
Last 12 months.
Table configuration button. Using this button, you can customize the appearance of the table yourself.
The alert menu contains the following options:
“Details” — opens the alert description page;
“Acknowledge” — opens a window that closes the alert. In the window, you can write a solution for the alert and close it manually.
Alert description
To open this page, click on “Details” in the alert menu.
The page has three tabs:
Overview,
Related alerts,
Event log.
“Overview” tab
The tab displays detailed information on the alert.
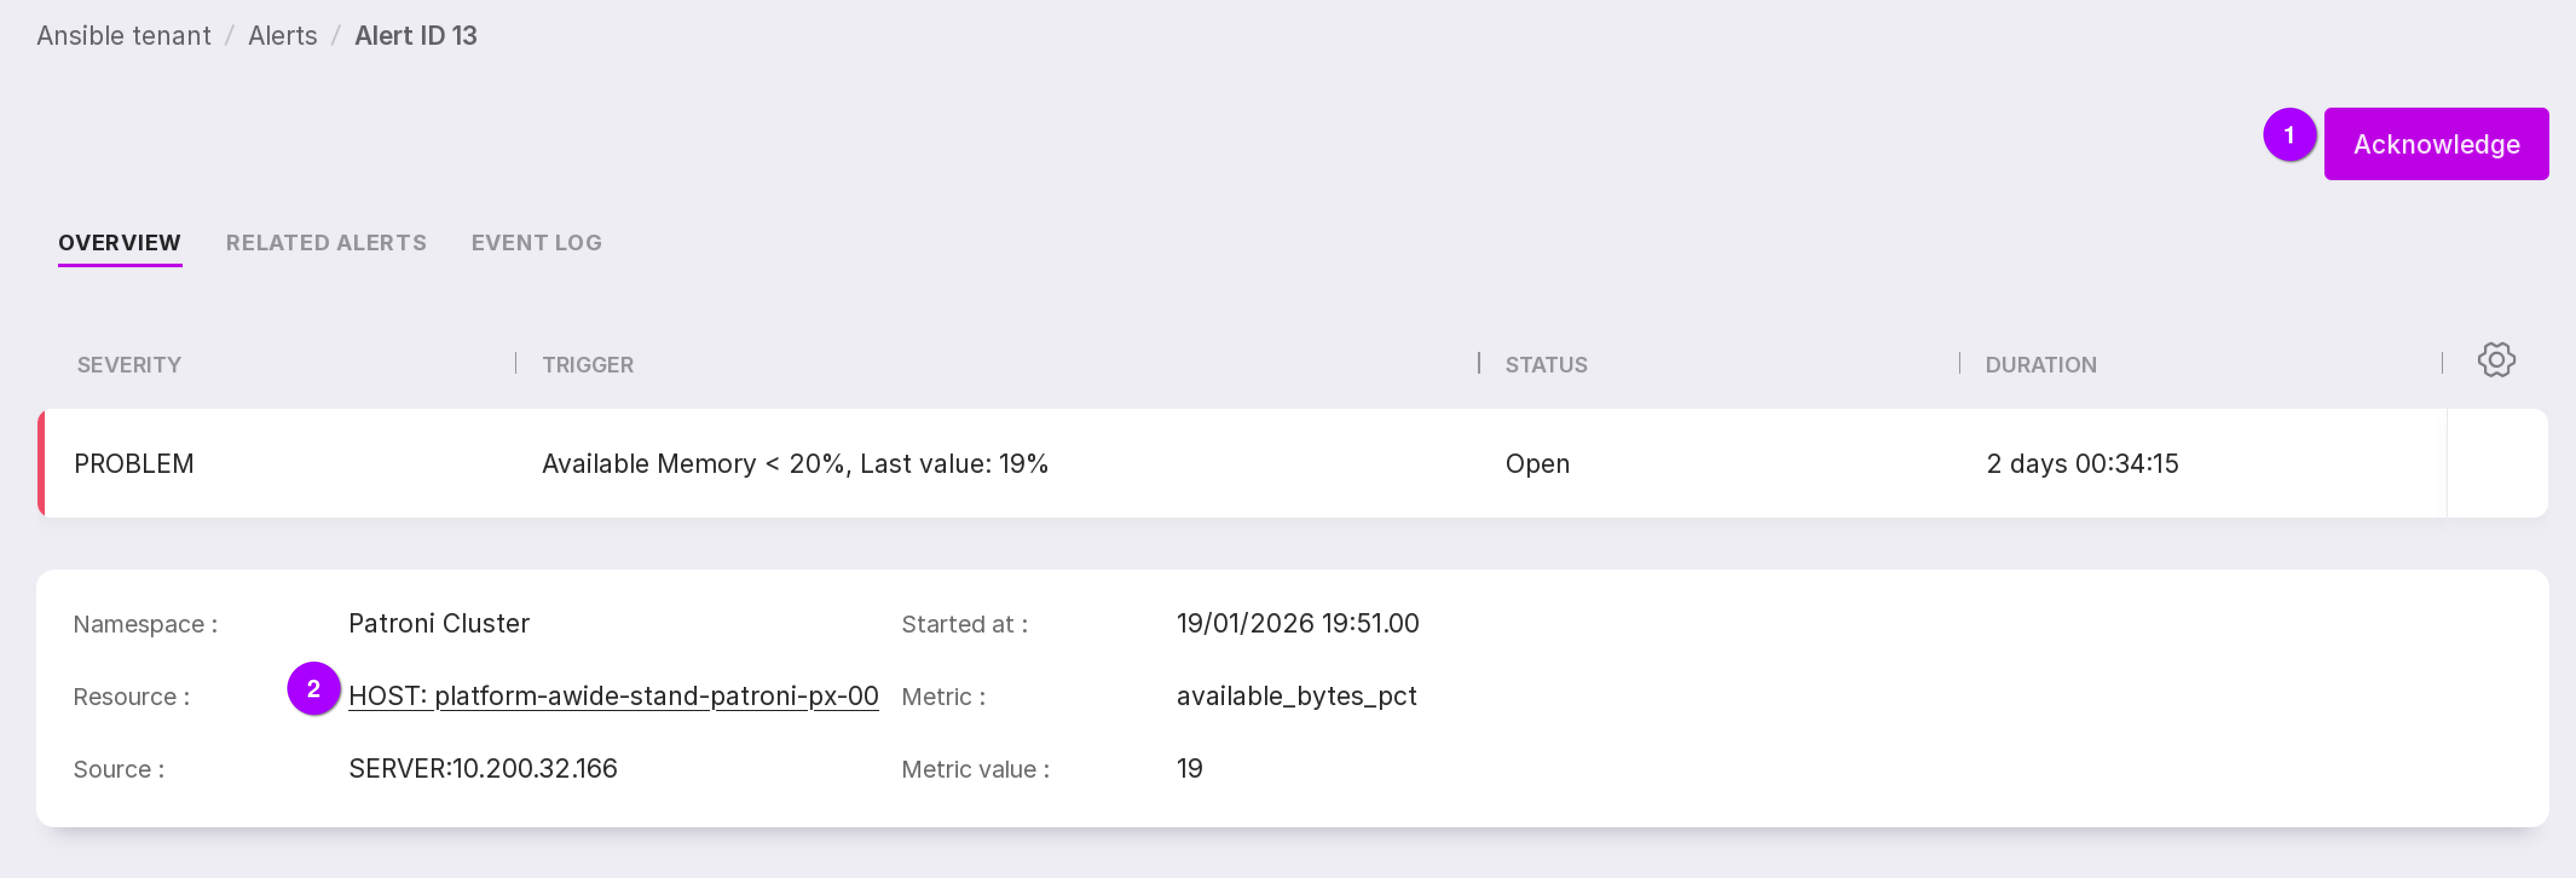
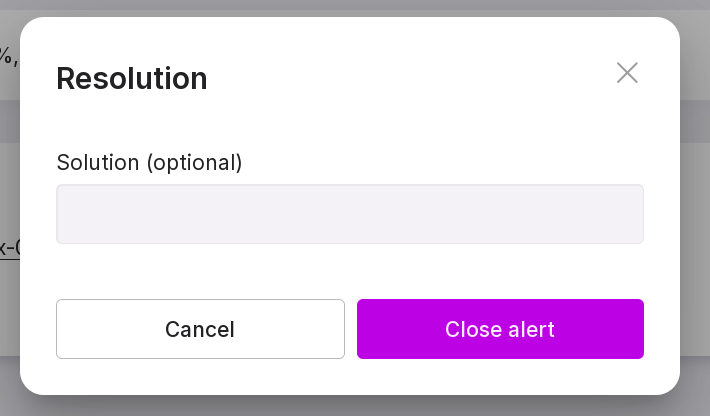
The “Acknowledge” button opens a window where you can describe the solution for the problem or the reason for closing to manually close the alert. In the opened window, describe the alert solution in the text field and click “Close alert”.
Note
This option is not available for users with view-only rights.
The alert state shall be “Open.”
After closing, the right column will be filled with information:
in the “Acknowledged at” section, the closing date of this alert will appear;
in the “Acknowledged by” section, the name of the user who manually closed this alert will appear;
in the “Solution” section, a description of the reason for manually closing the alert will appear.
You can follow the link to the “Overview” page of the instance for which the alert was received.
“Related alerts” tab
The “Related alerts” tab displays alerts related to the selected one. Using related alerts, you can learn additional information and decide how to proceed with the selected alert.
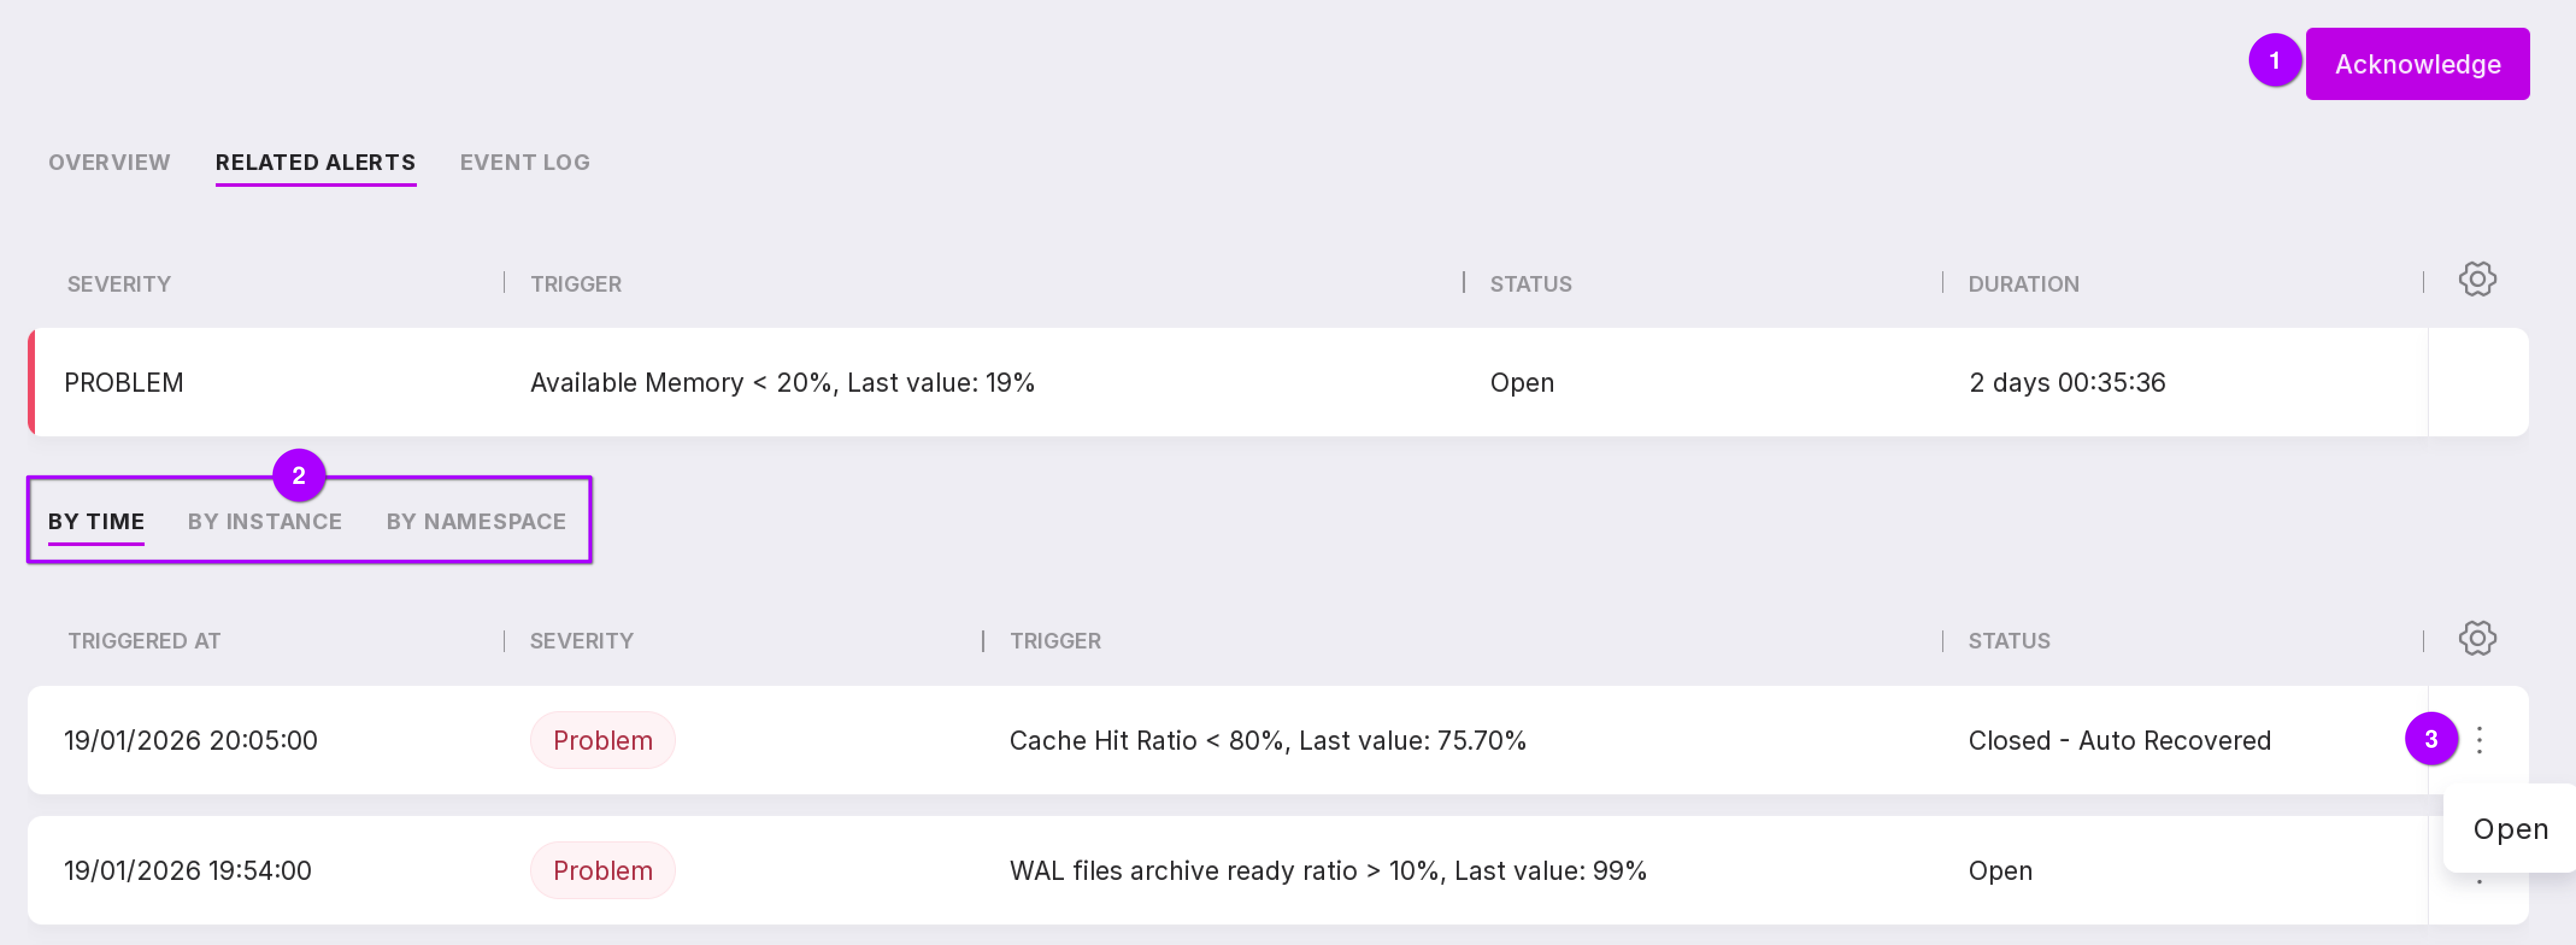
Let’s review the information on the tab, as numbered in the figure above:
The “Acknowledge” button allows you to close the alert.
Related alerts can be sorted by time, instance, and namespace.
Through the menu, you can open the description page of the alert selected from the list.
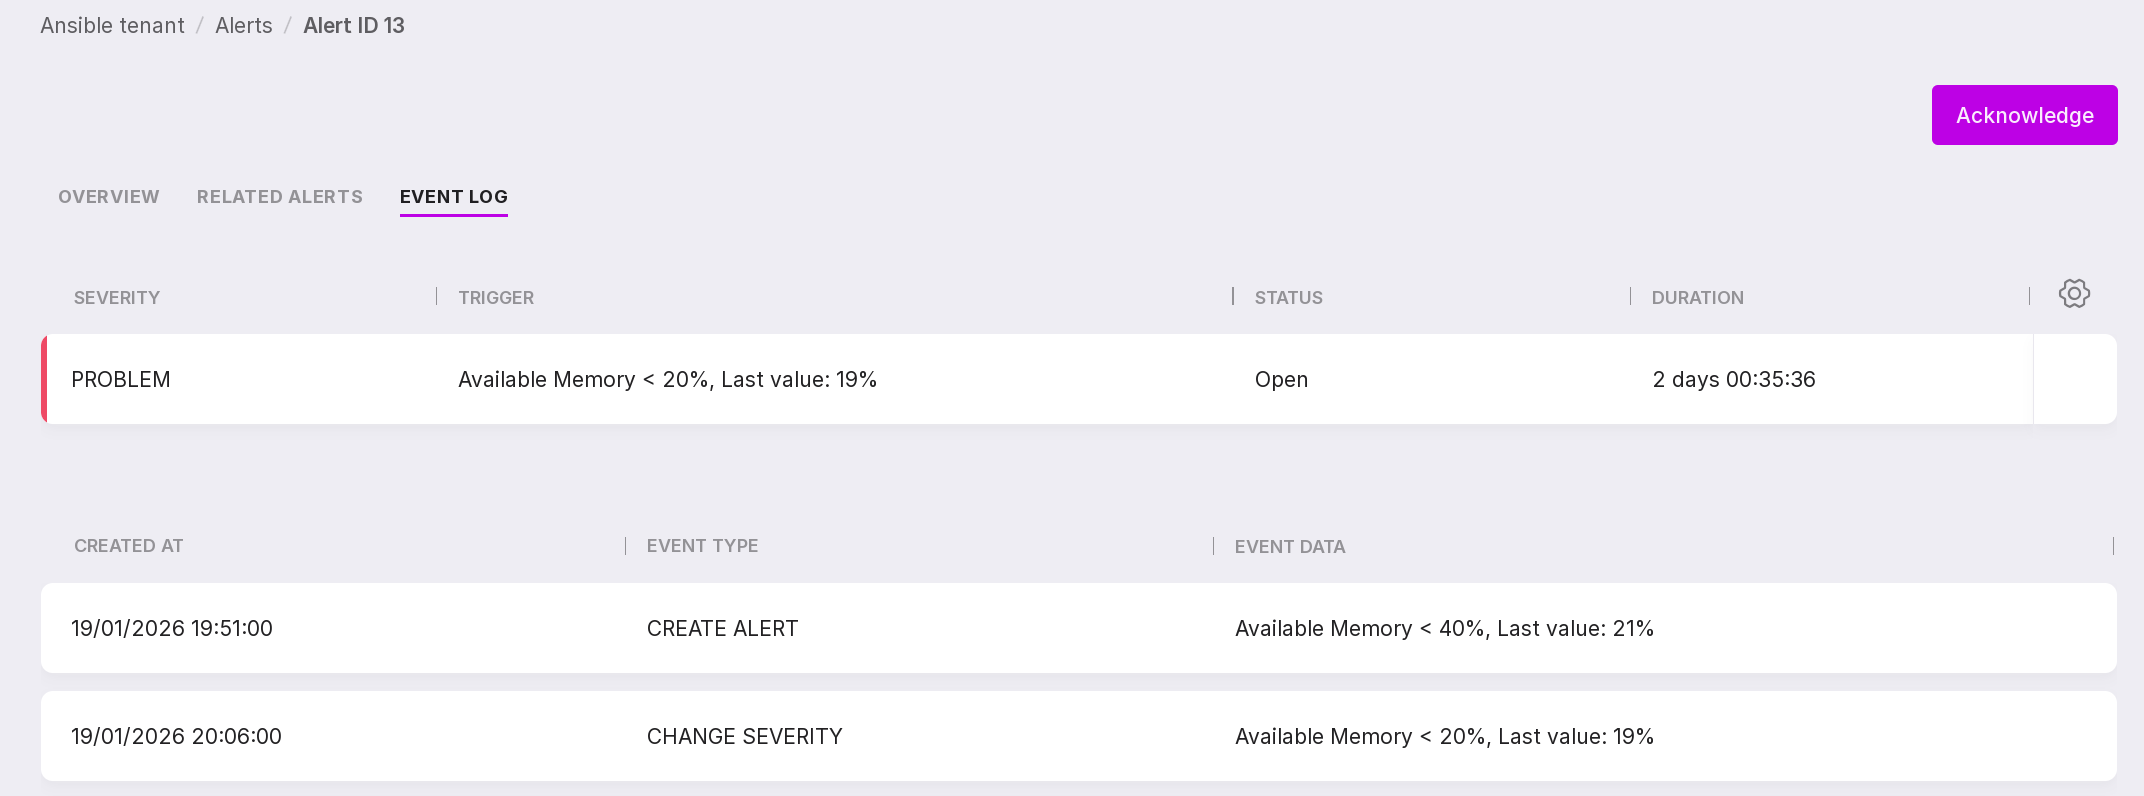
“Event Log” tab
The “Event Log” tab displays events related to the alert, such as when the alert was opened and closed.