Instance Overview
The “Overview” page displays tiles containing the performance indicators of Platform, DBMS, and related system hardware.
The main menu is presented on the left side of the page:
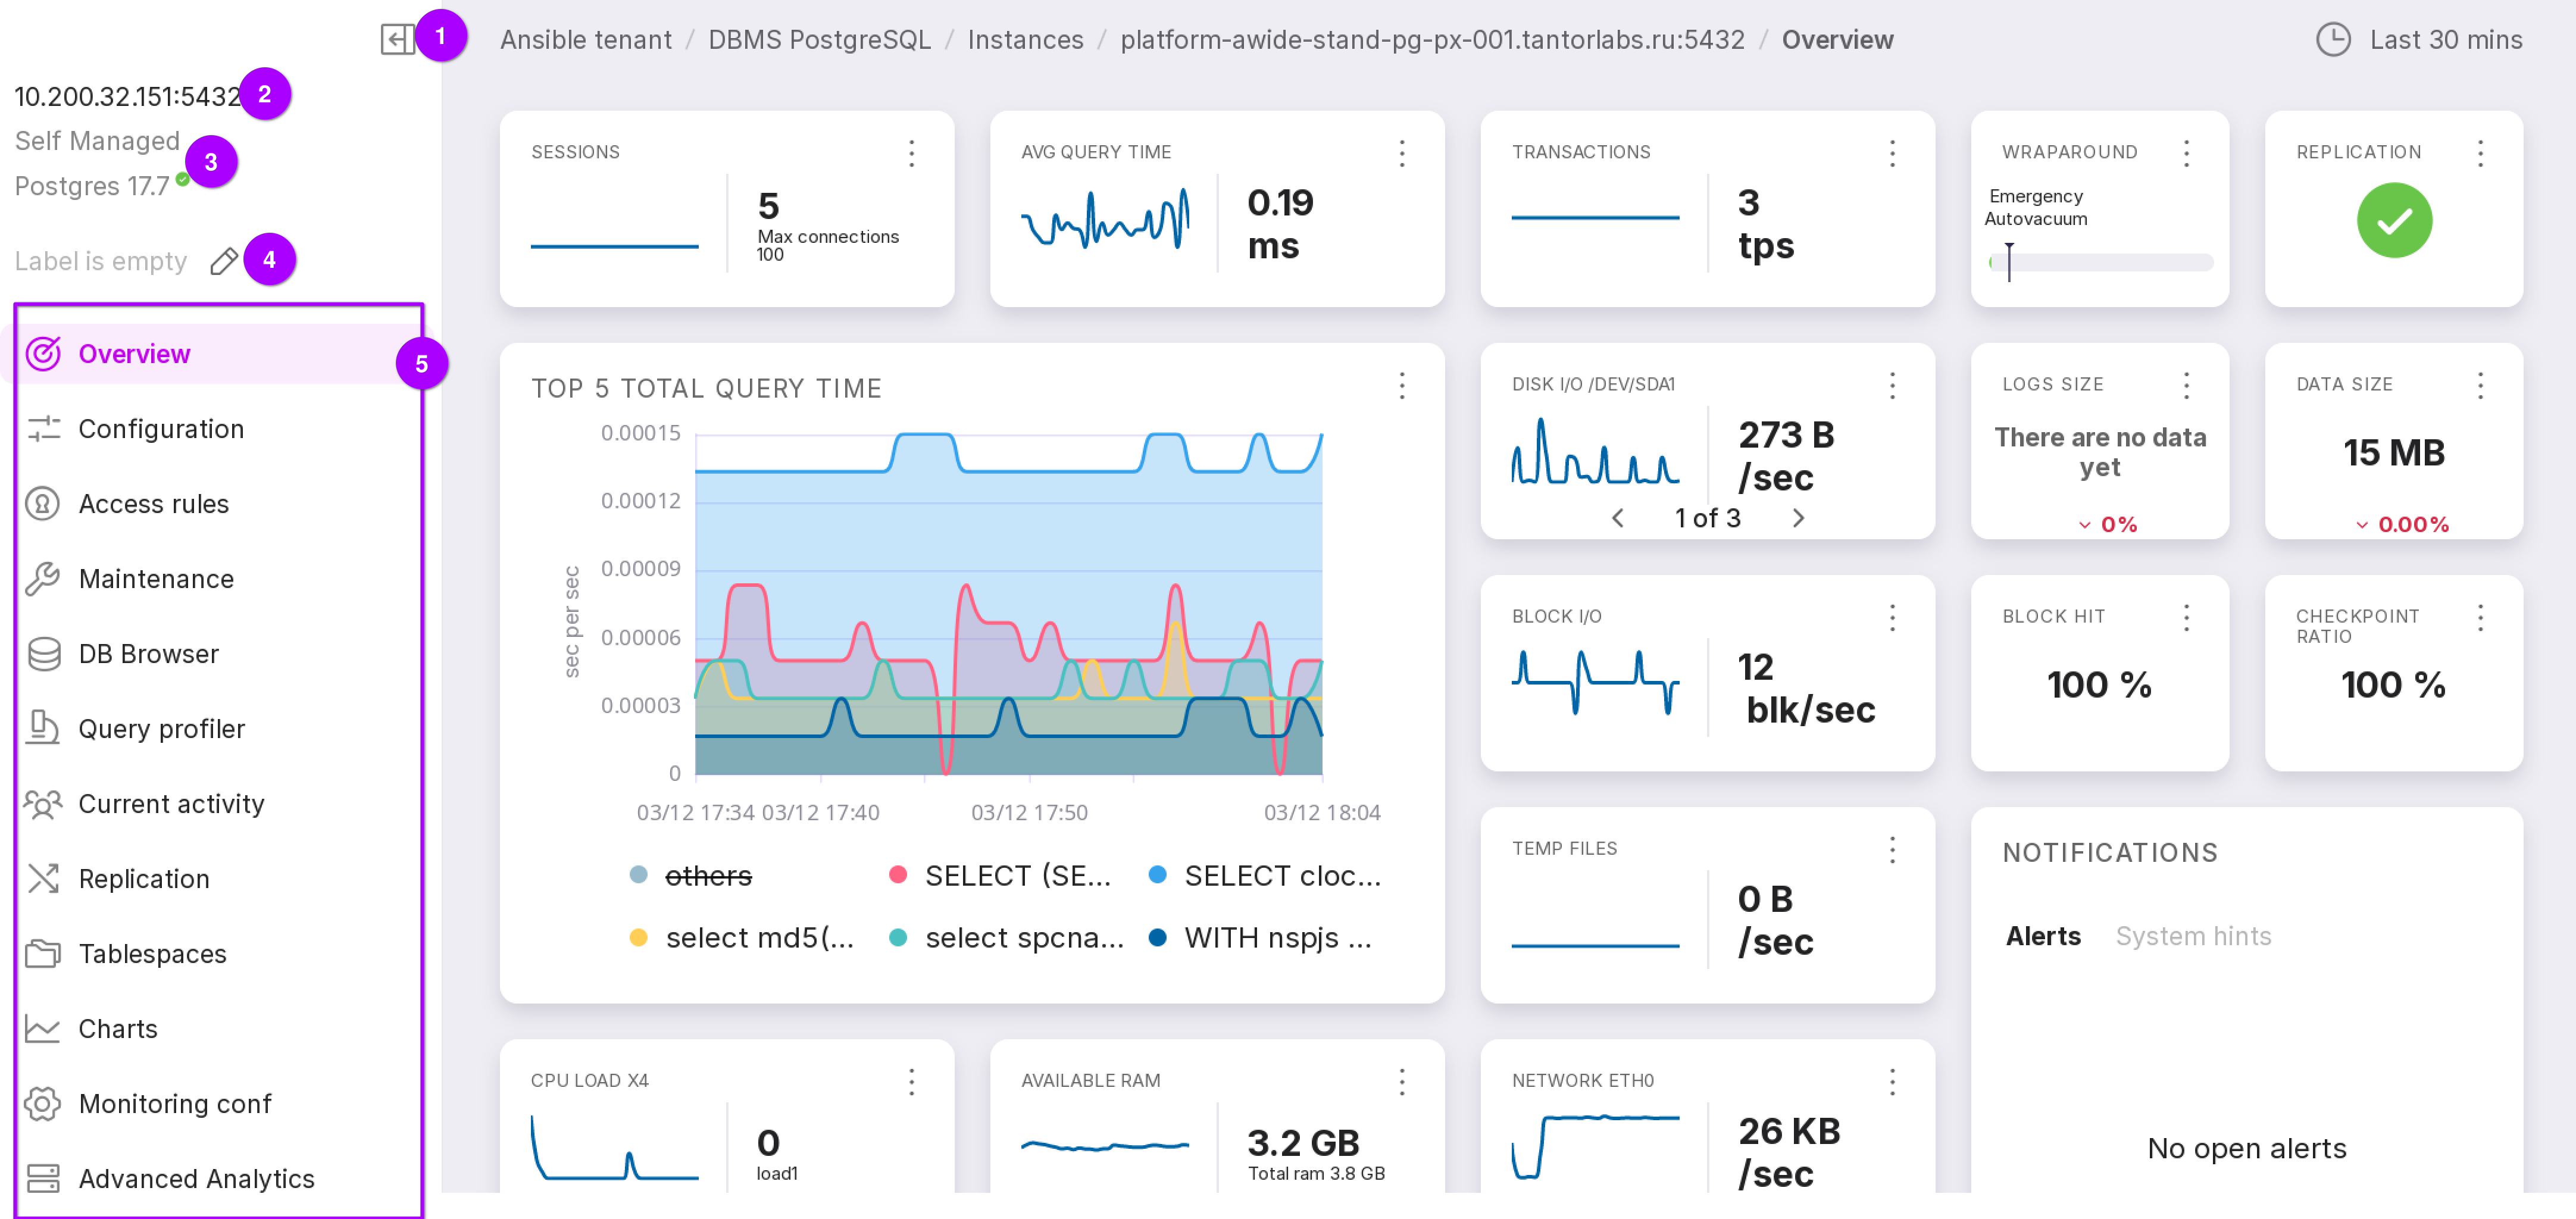
A button that allows you to collapse the menu.
IP and port.
Type, edition, and version of the DBMS.
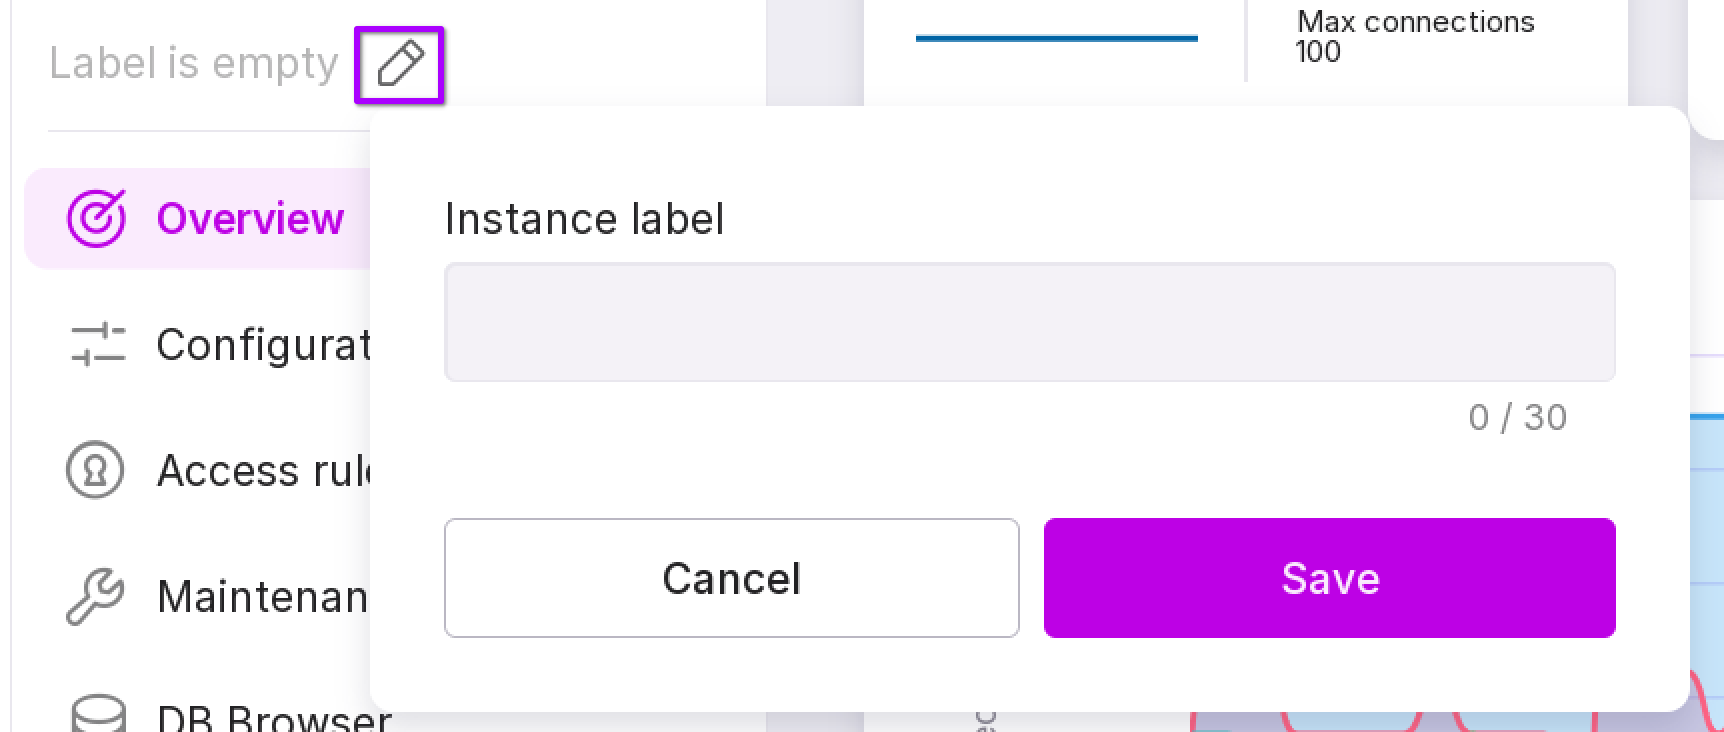
Label. Click on the pencil icon to add or edit the label.
Instance menu consisting of the following items:
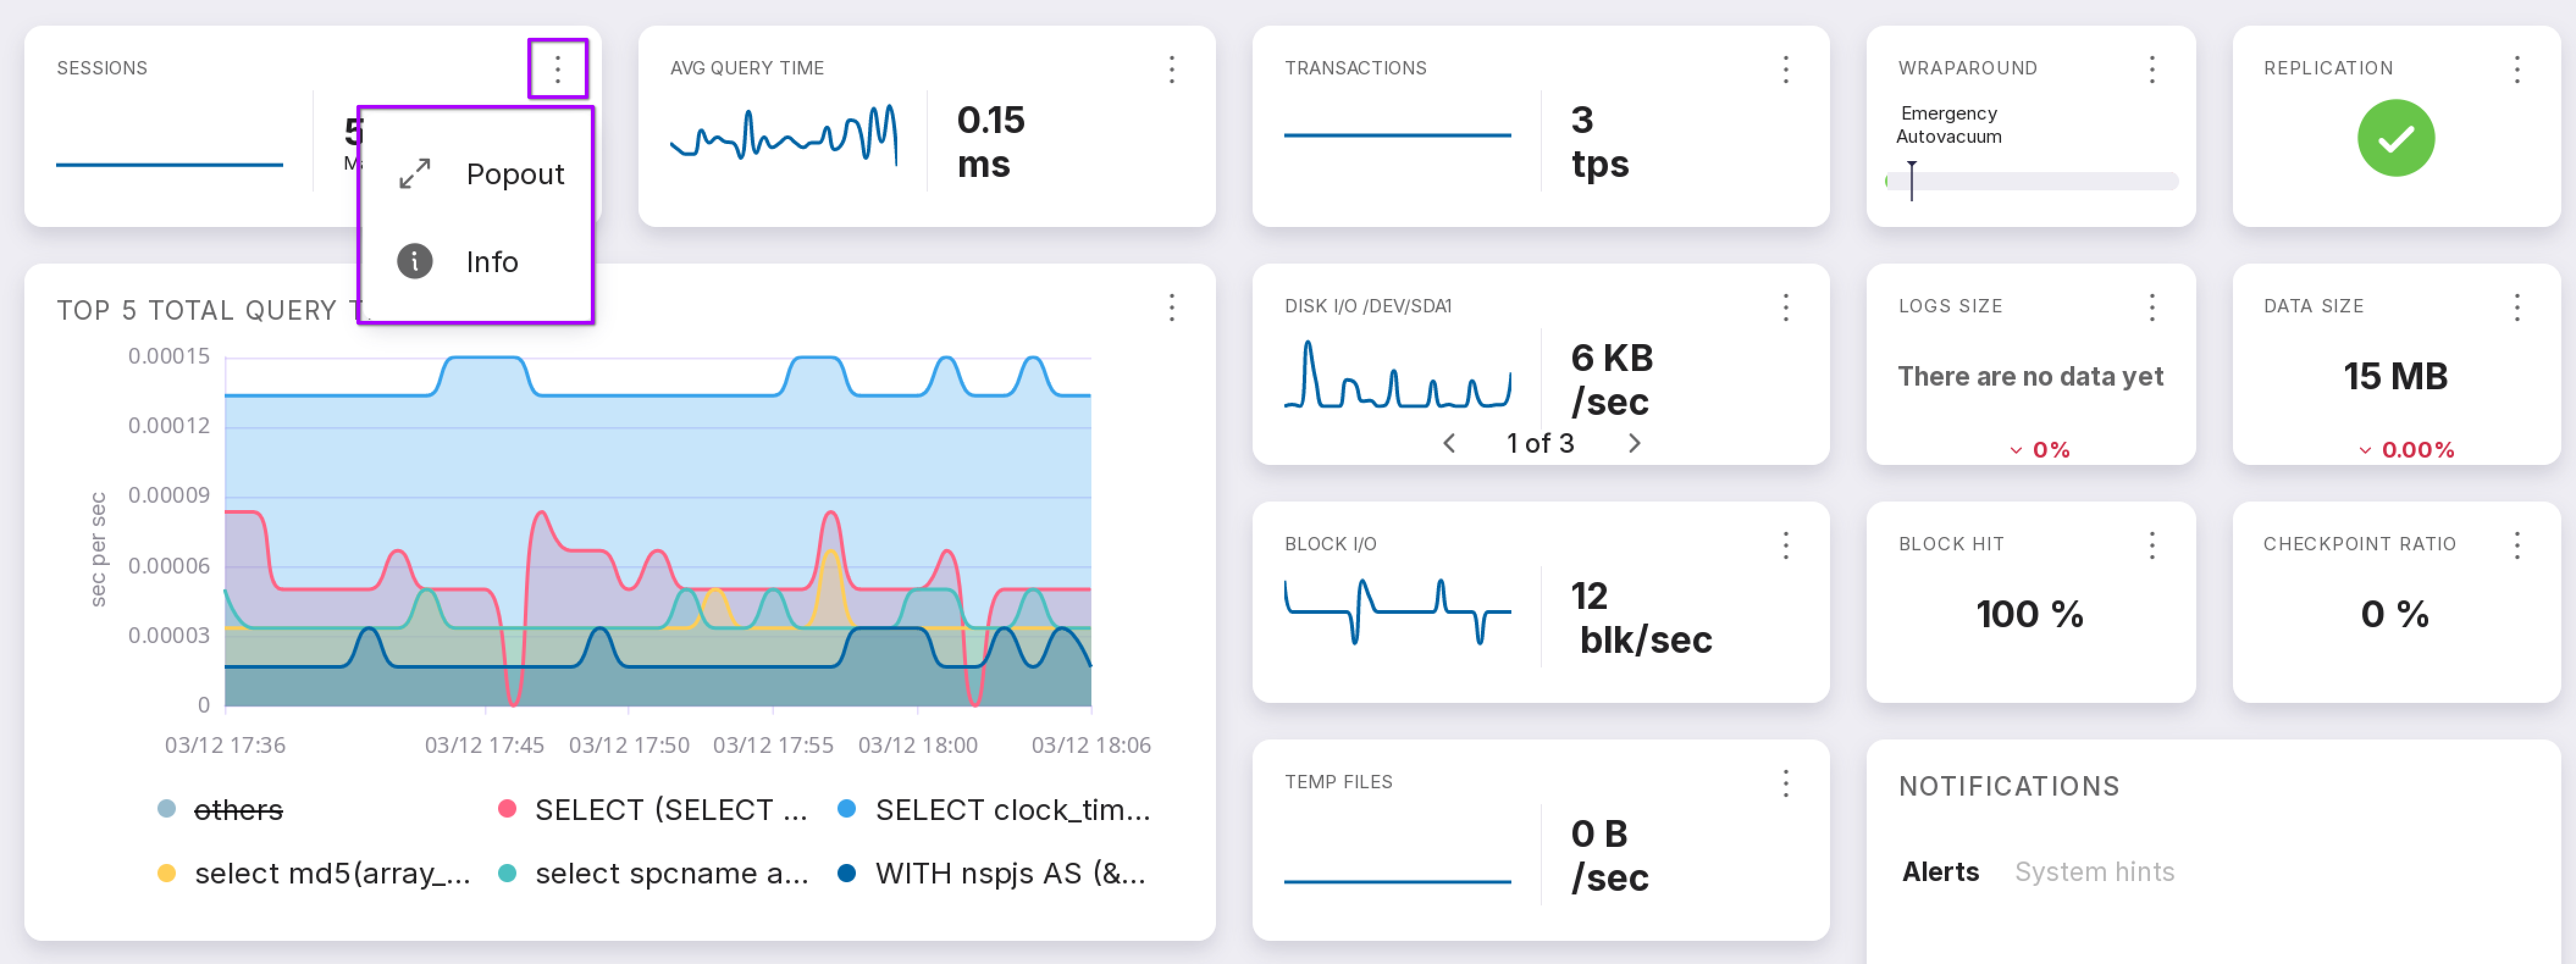
Each tile has a menu with the following options:
“Popout” — expands the window to show detailed information and allows you to view the metric chart.
“Info” — technical description of the tile.
In the metric chart tile, you can specify a specific date and select a time interval for displaying information. Seven time intervals are available:
the last 30 minutes. Default value;
the last hour;
the last 3 hours;
the last 8 hours;
the last 12 hours;
the last day;
the last 7 days.
If there are multiple indicators, the unnecessary ones can be hidden. To do this, click on the name of the indicator you want to remove from the chart.
In the “Top 5 total query time” ile, the query texts are shown at the bottom of the chart. Click on the query to hide it.
“Sessions” Tile
Shows the current application or client connections to the database. Each connection creates a session that uses memory on the server.
The chart shows the number of connections over the last 30 minutes. The maximum number of connections is defined in the configuration.
The color indicator on the tile denotes the state of sessions:
red — problem. The total number of used sessions or the number of pending sessions exceeds the preset values for the corresponding triggers;
yellow — warning. The total number of used sessions or the number of pending sessions exceeds the preset values for the corresponding triggers;
white — ok.
The following charts are displayed in the popout window:
“Active” — the current number of active queries;
“Waiting” — the number of queries waiting. If the state is active and waiting is non-null, it means the query is being executed but is blocked somewhere in the system;
“Idle” — unused connections to the database. Some frameworks identify such connections and support a connection pool.;
“Idle in Transaction” — connections waiting for the transaction to complete;
“Idle in Transaction Aborted” — connections with errors during the transaction;
“Fastpath” — the number of queries processed by the fastpath function;
“Disable” — reported if the track_activities parameter is disabled for this backend.
“Average Query Time” Tile
Displays the latest value of the average execution time of the top 50 queries.
The chart shows changes in this duration.
The popout window on the chart displays the average query execution time for the specified period.
“Transactions” Tile
Displays the number of transactions per second, including commits and rollbacks.
The chart shows the total volume of transactions over the last 30 minutes.
The color indicator on the tile indicates the state:
red — problem. The total number of transactions executed per second exceeds the preset values for the corresponding trigger;
yellow — warning. The total number of transactions executed per second exceeds the preset values for the corresponding trigger;
white — ok.
Sensitivity can be adjusted on the triggers page.
The yellow and red thresholds indicate errors and warnings in the number of transactions per second.
The popout window displays a chart for the following values:
“Committed” — the number of saved changes in the database;
“Rollbacked” — the number of rolled back transactions.
“Wraparound” Tile
The progress bar with a gradient color line shows the filling of the transaction counter.
The marker on the progress indicator is taken from the configuration file and shows the expected start of the emergency autovacuum procedure.
“Replication” Tile
Replication continuously copies data to replica server. States:
gray stop sign — replication is not configured;
green checkmark — replication is working without failures;
red triangle — replication failure.
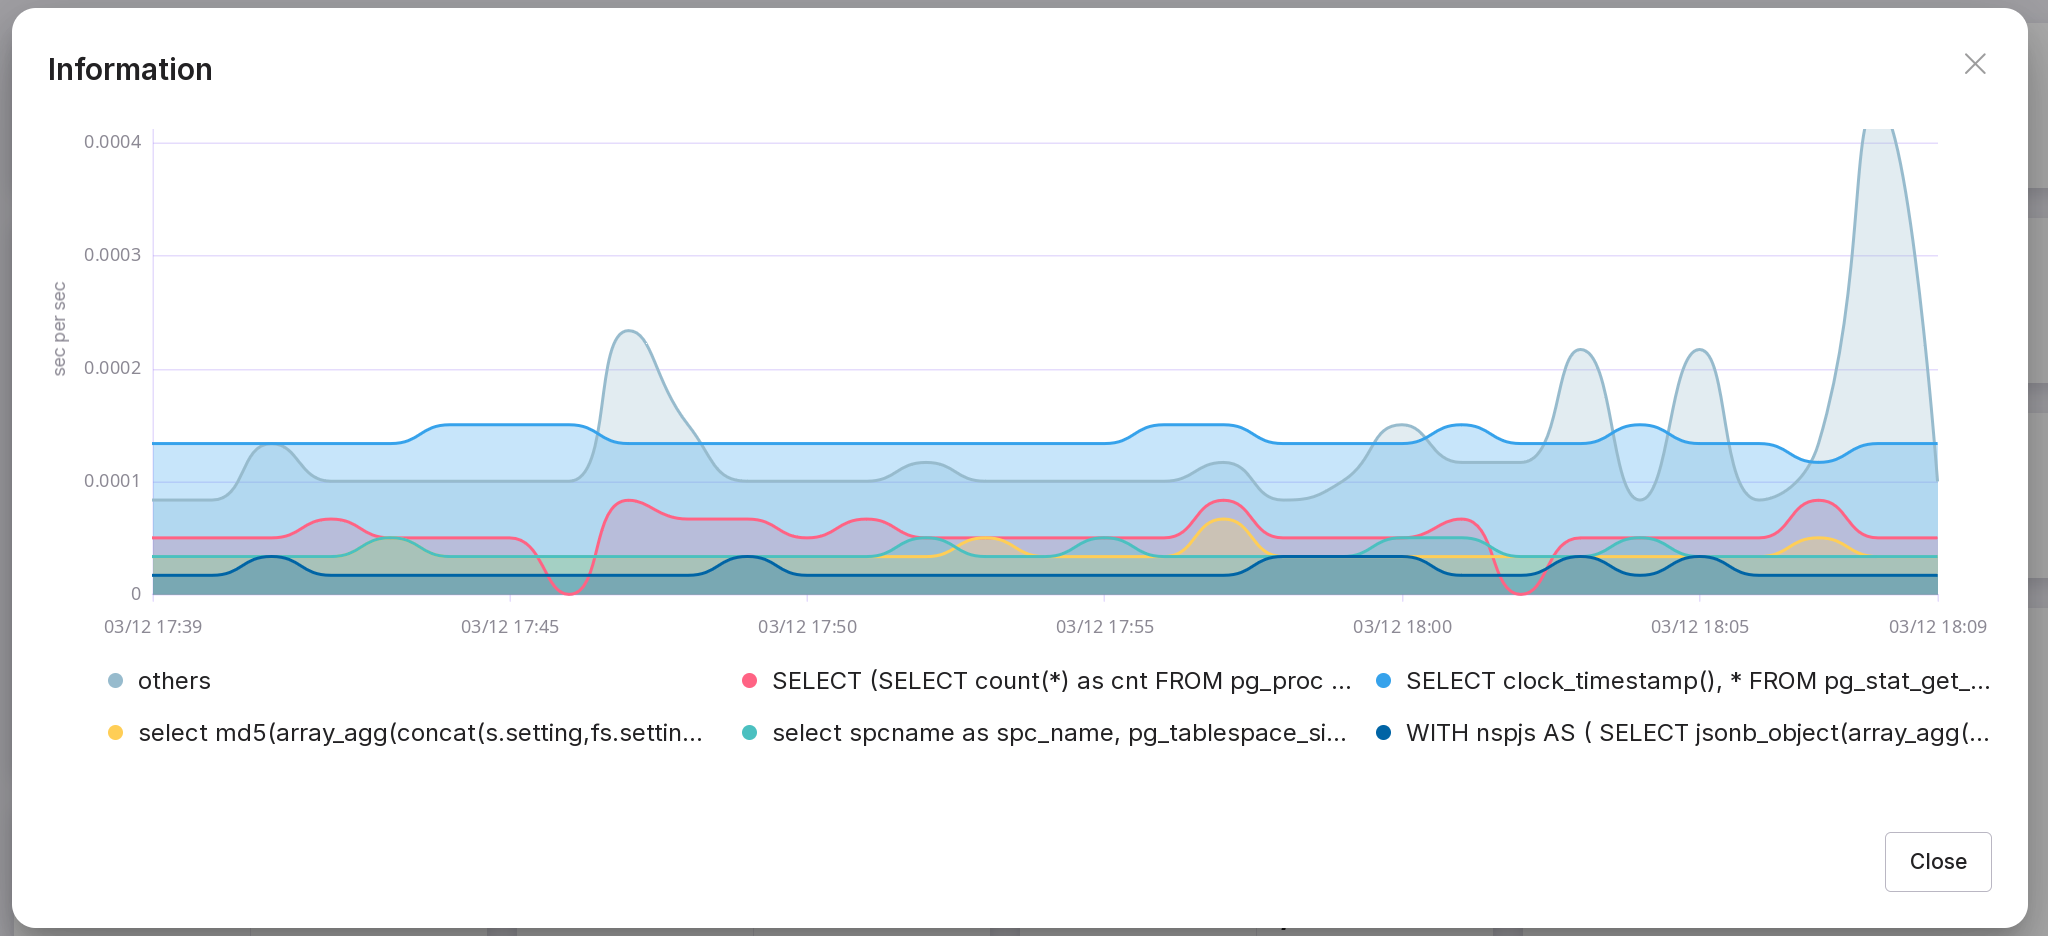
“Top 5 total query time” Tile
The chart displays aggregated data of the five longest queries for the last specified period of time. The Y-axis measures time in seconds per second. Queries not in the top 5 are aggregated into the “others” slot. To display them, click on the chart. You can hide and show metrics by clicking on them.
To go to the query profiler, click on the query below the chart and select “Details.”
The popout window displays the same charts, but with a selection of the time range.
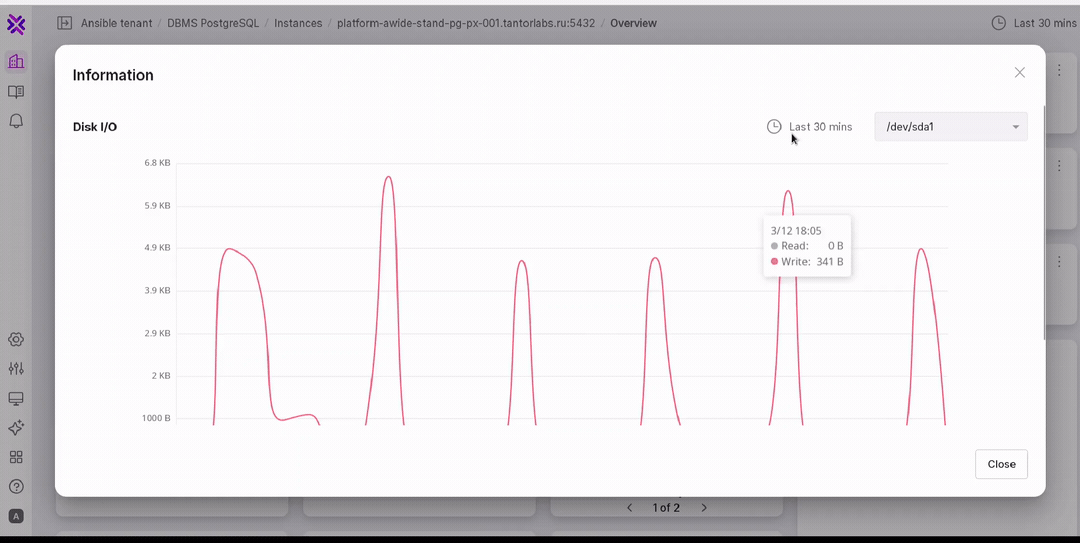
“Disk I/O” Tile
Shows the data transfer rate between the hard drive and RAM.
The chart shows the data transfer rate between the hard drive and RAM for the last half hour.
The popout window displays the speed of read and write operations.
“Block I/O” Tile
Shows the last value of the speed at which the application or file system sends blocks to the disk for writing or reading. Data is stored in fixed blocks in linear address namespace.
The chart shows the growth of written and read blocks per second.
The chart in the popout window shows the following values:
“Dirtied” — the total number of “dirty” blocks. That is, when at least one tuple in the block has been modified by the query, and this block needs to be written to disk. Writing to disk will occur at a checkpoint or through the “bgwriter” process;
“Read” — the total number of local blocks read by the operator;
“Write” — the total number of local blocks written by the operator;
“Temp Read” — the total number of temporary blocks read by the operator;
“Temp Write” — the total number of temporary blocks written by the operator.
“Temporary Files” Tile
Shows the last volume of temporary data on disk.
The chart shows changes over the last 30 minutes.
The color indicator on the tile indicates the state:
red — disk namespace is exhausted;
yellow — warning of approaching the limit;
white — ok.
Can be gonfigured in triggers.
The popout shows the size of temporary files over the selected period of time.
“Logs Size” Tile
Shows the current size of the log, the numbers below show the change in percentage.
The popout specifies the size of the log for the selected period.
The color indicator on the tile indicates the state:
red — limit exceeded;
yellow — close to the boundary;
white — ok.
The sensitivity can be configured in triggers.
“Data Size” Tile
Shows the total physical size of databases on this instance. The number below indicates the percentage change in sizes compared to the previous period.
The popout window displays a chart with the total size of databases over the selected time interval.
“Block hit” Tile
Displays the number of ‘hit’ blocks, which represents the number of queries to table indexes found in the buffer cache during the last measurement period.
In the popout window, the chart shows the block read ratio, indicating the percentage of queries to table indexes processed by the buffer cache over the selected time interval.
The color indicator on the tile indicates the state:
red — problem — insufficient number of blocks read from the buffer cache, reading occurs from disk;
yellow — warning — insufficient number of blocks read from the buffer cache, reading occurs from disk;
white — ok.
These values can be configured on the triggers page. The warning and problem thresholds for the block read ratio are yellow and red, respectively.
“Checkpoint ratio” Tile
Forced checkpoints occur when the write-ahead log reaches the maximum size specified in the configuration.
Automatic checkpoints are generated automatically at a specified interval defined in the configuration.
The main screen displays the current percentage of completed checkpoints.
The popout window presents a chart for checkpoint types: ‘Automatic’ and ‘Required’. If forced checkpoints exceed 25% per hour, there will be a warning; if more than 50% — a problem message.
These parameters are configurable on the triggers page.
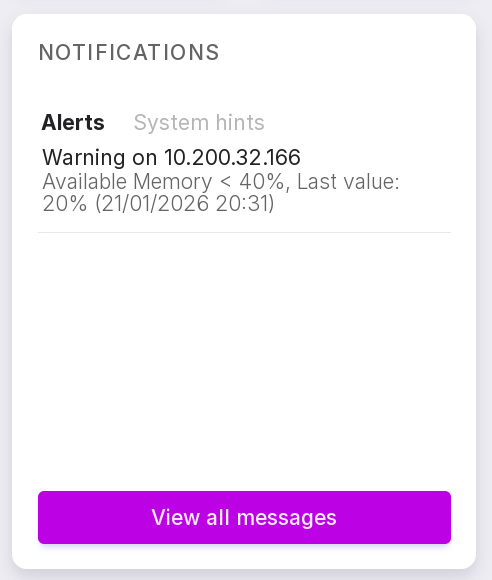
“Notifications” Tile
Alerts and system prompts include messages about data exports, successful task completions, update requirements, and other events. This provides timely information and allows for effective system monitoring and event response.
If you click on one of the alerts, you will be taken to a page with detailed information on the alerts. To go to the page of all alerts, click “View All Messages”.
“CPU Load” Tile
Shows CPU load relative to the number of cores, where “X” in the tile title indicates the number of CPU cores (e.g., “X2” means a dual-core processor).
The chart shows the increase in CPU usage over the last 30 minutes.
“Load1” means that the chart line and the main value reflect the average load over the last minute.
The color indicator on the tile indicates the state:
red — warning of a problem, the CPU is overloaded;
yellow — warning, the CPU is close to maximum load;
white — CPU load is normal.
Thresholds for yellow and red indicators can be configured on the triggers page.
The popout window displays a chart for the following values:
“load1” — average load over the last 1 minute;
“load5” — average load over the last 5 minutes;
“load15” — average load over the last 15 minutes.
“Available RAM” Tile
Shows the current amount of available RAM.
The chart shows the amount of available memory over the last 30 minutes.
“Total RAM” — total installed memory.
The color indicator on the tile indicates the state:
red — warning of memory overflow;
yellow — close to a warning about memory usage;
white — normal state.
Settings can be changed in triggers.
The popout window displays a chart for the following values:
“Available” — assessment of the amount of memory available for launching new applications without swapping;
“Buffers” — memory used by kernel buffers;
“Cached” — memory used by the file cache and SLAB allocator/allocation objects.
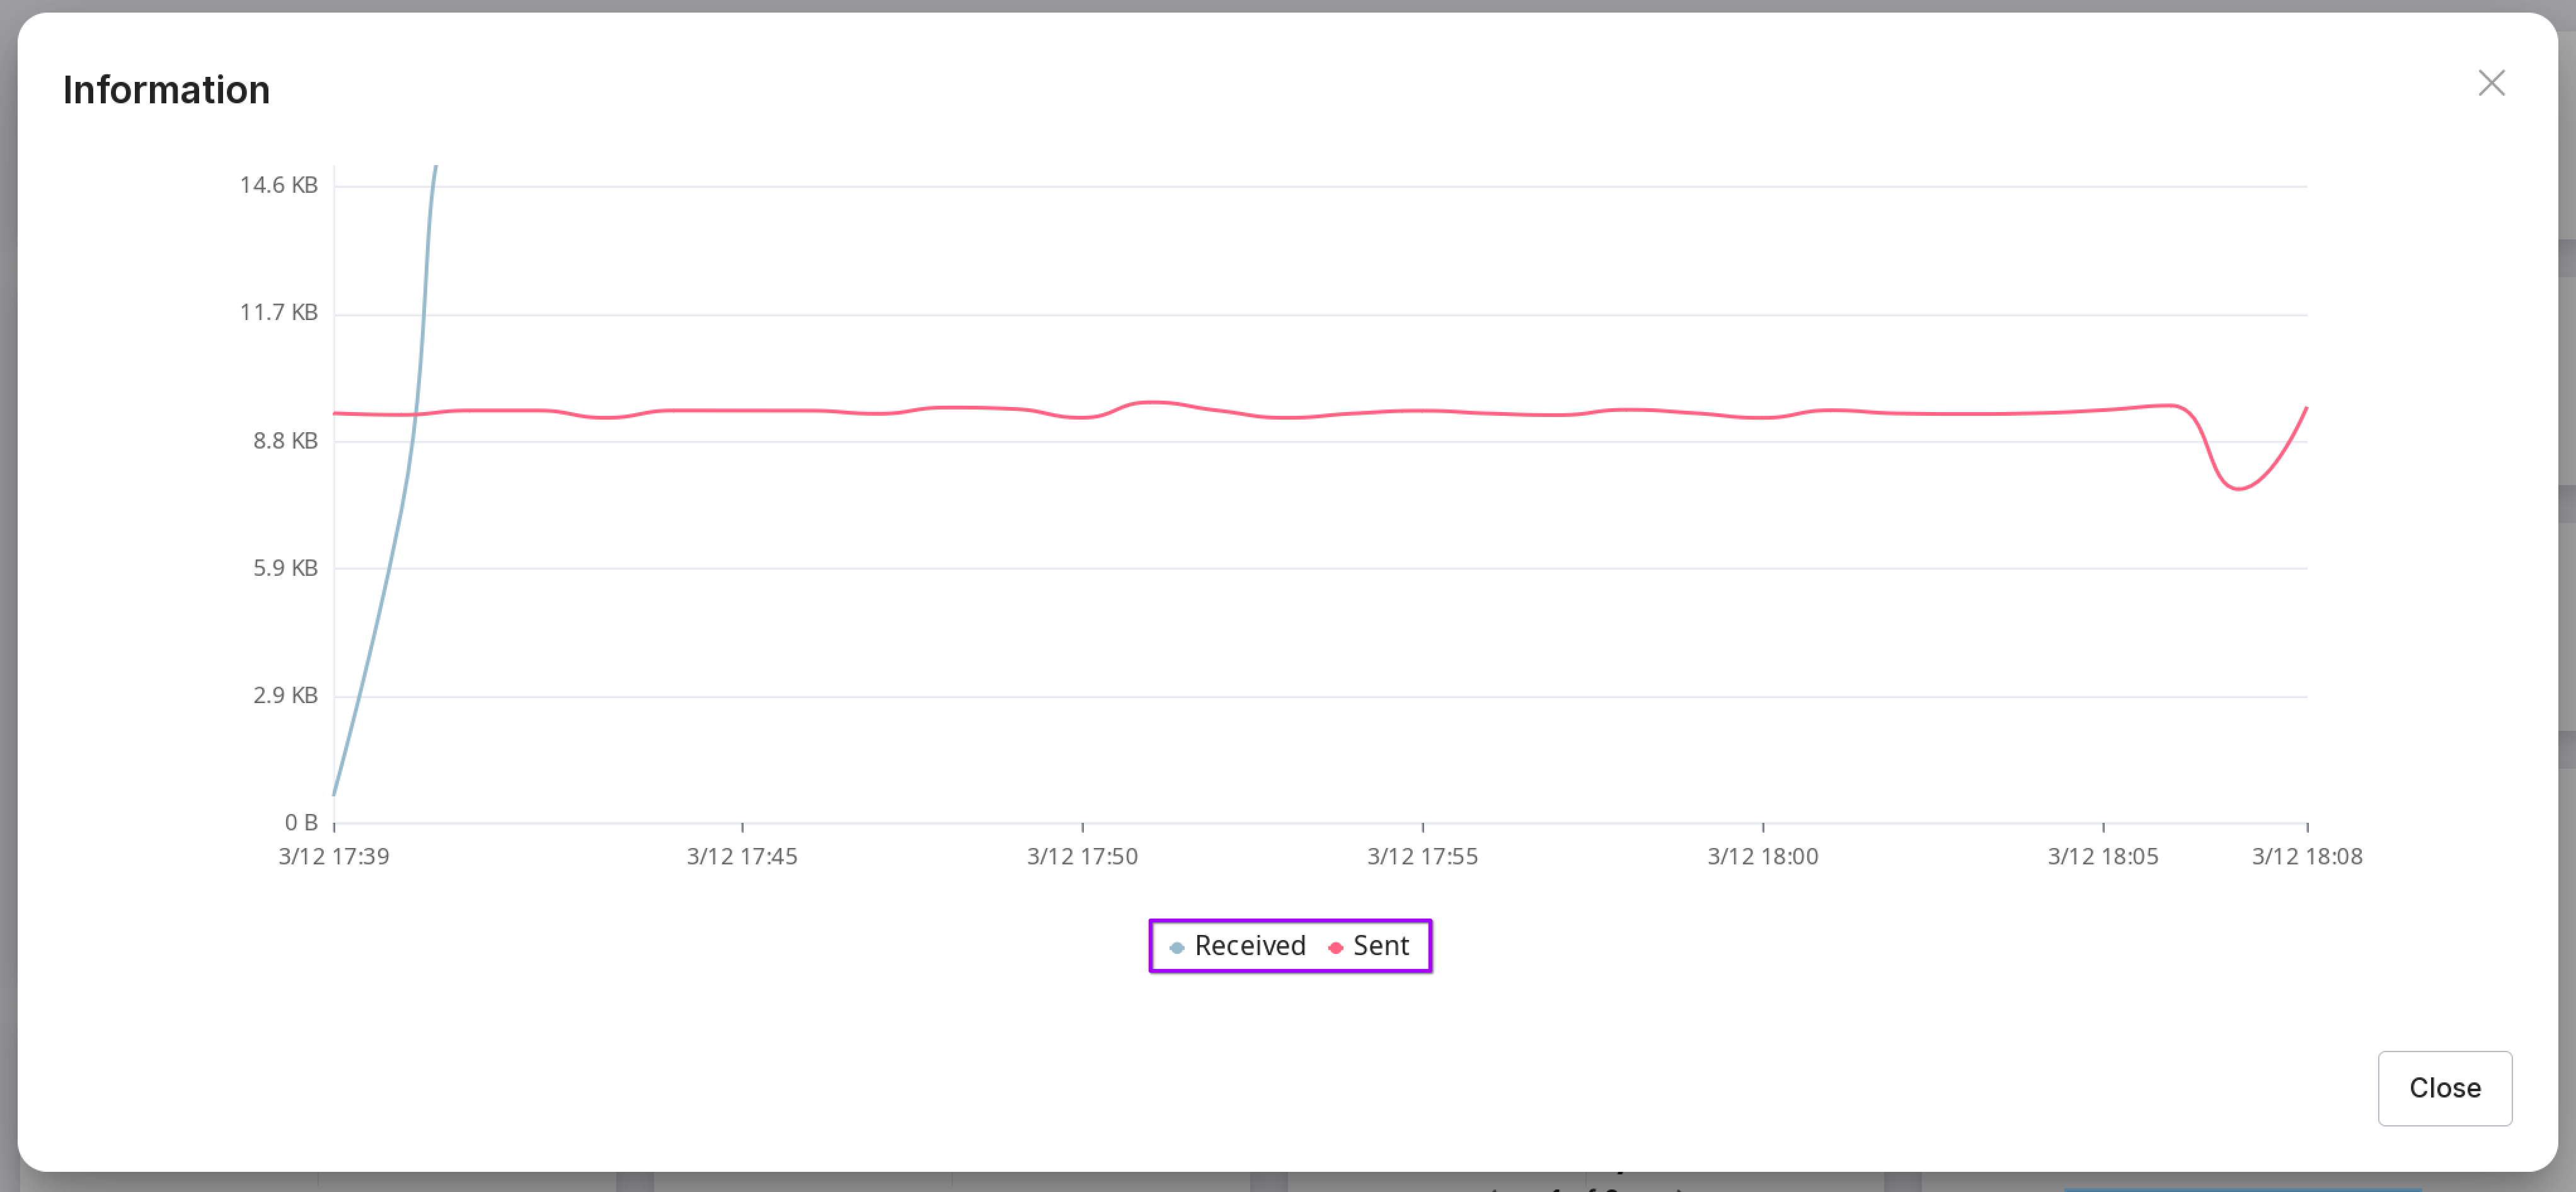
“NETWORK ETH0” Tile
Shows the current network speed and allows switching between different network interfaces using arrows.
The popout window displays information on received and sent data.
“Storage root” Tile
Shows the current size of the instance and its changes over time.
The total storage volume is the maximum amount of memory that the system uses to store persistent objects.
The color indicator on the tile indicates the state:
red — warning when available memory is low;
yellow — warning when available memory is close to low;
white — ok.
Indicator settings can be configured in triggers.
The popout window displays a chart of available space over the selected period of time.
“WAL Files” Tile
Displays the current size of generated WAL files per second and their trending changes.
The color indicator on the tile indicates the state:
red — warning of a problem if the size of WAL files exceeds the allowable limit;
yellow — warning if WAL files are close to the warning limit;
white — ok.
Settings can be changed on the triggers page.
The popout window displays the WAL write speed chart for the selected time period.
“Autovacuum” Tile
Displays the current number of vacuum processes.
The chart shows changes in the number of processes.
The maximum number shows the simultaneously active vacuum worker processes.
In the popout window, the chart shows the number of active vacuum worker processes for the selected time period.