Cluster State
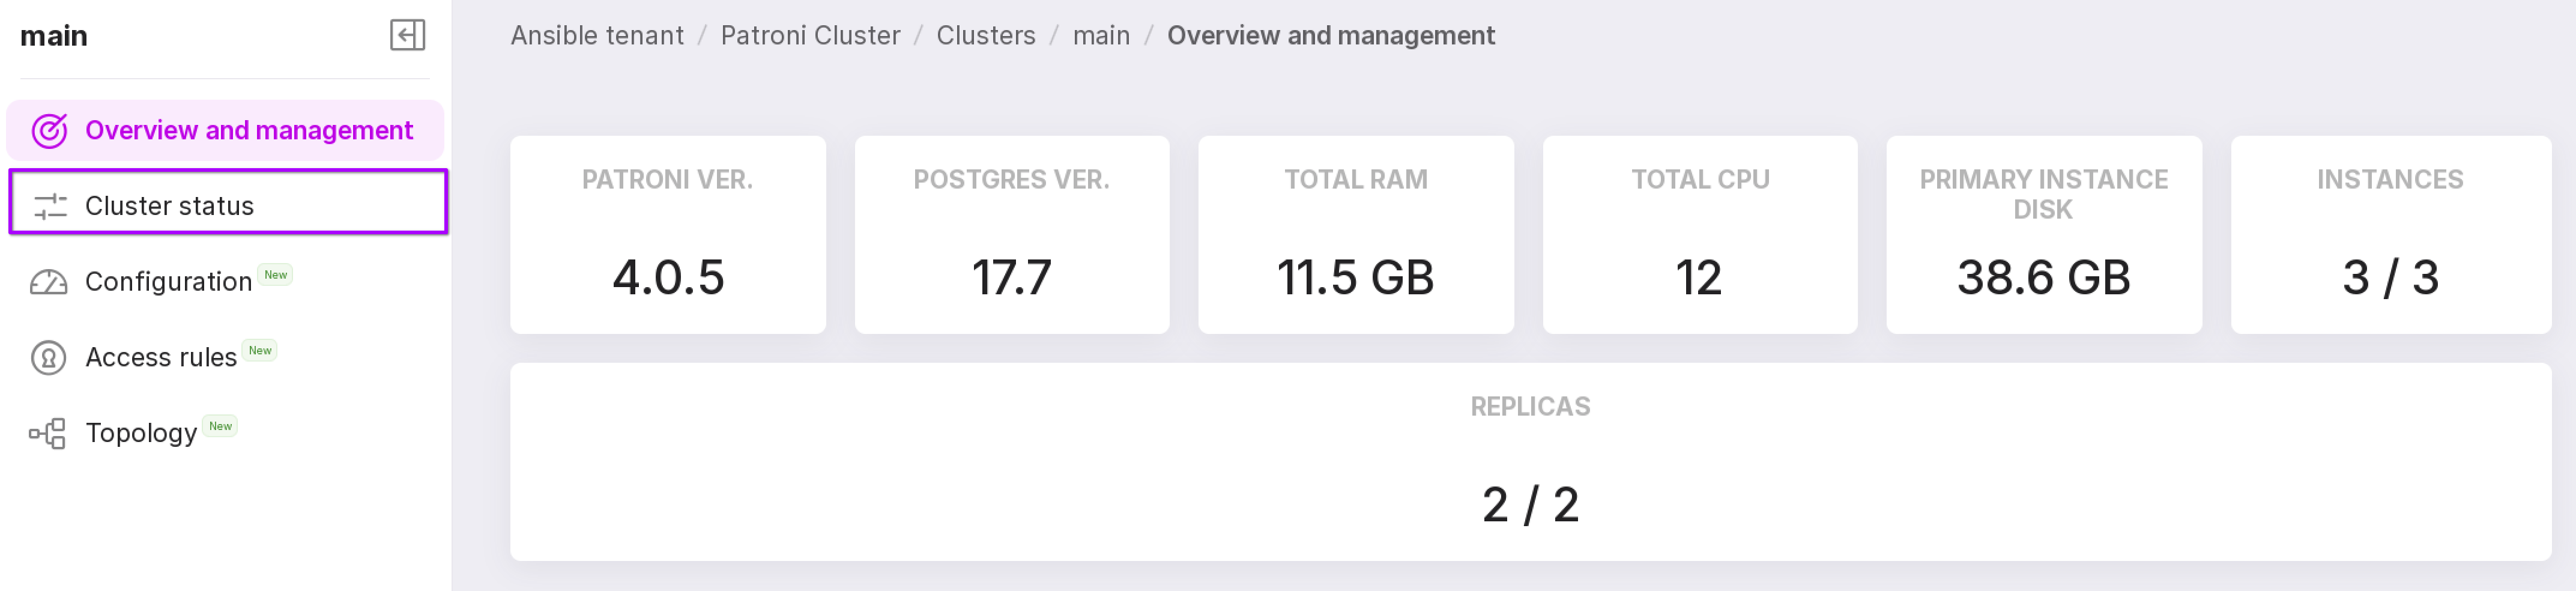
To open this page, click the row corresponding to the required cluster and select Cluster State from the left-hand menu.
This page displays a timeline chart showing role changes of cluster instances and a table with the history of node state changes over the specified time period.
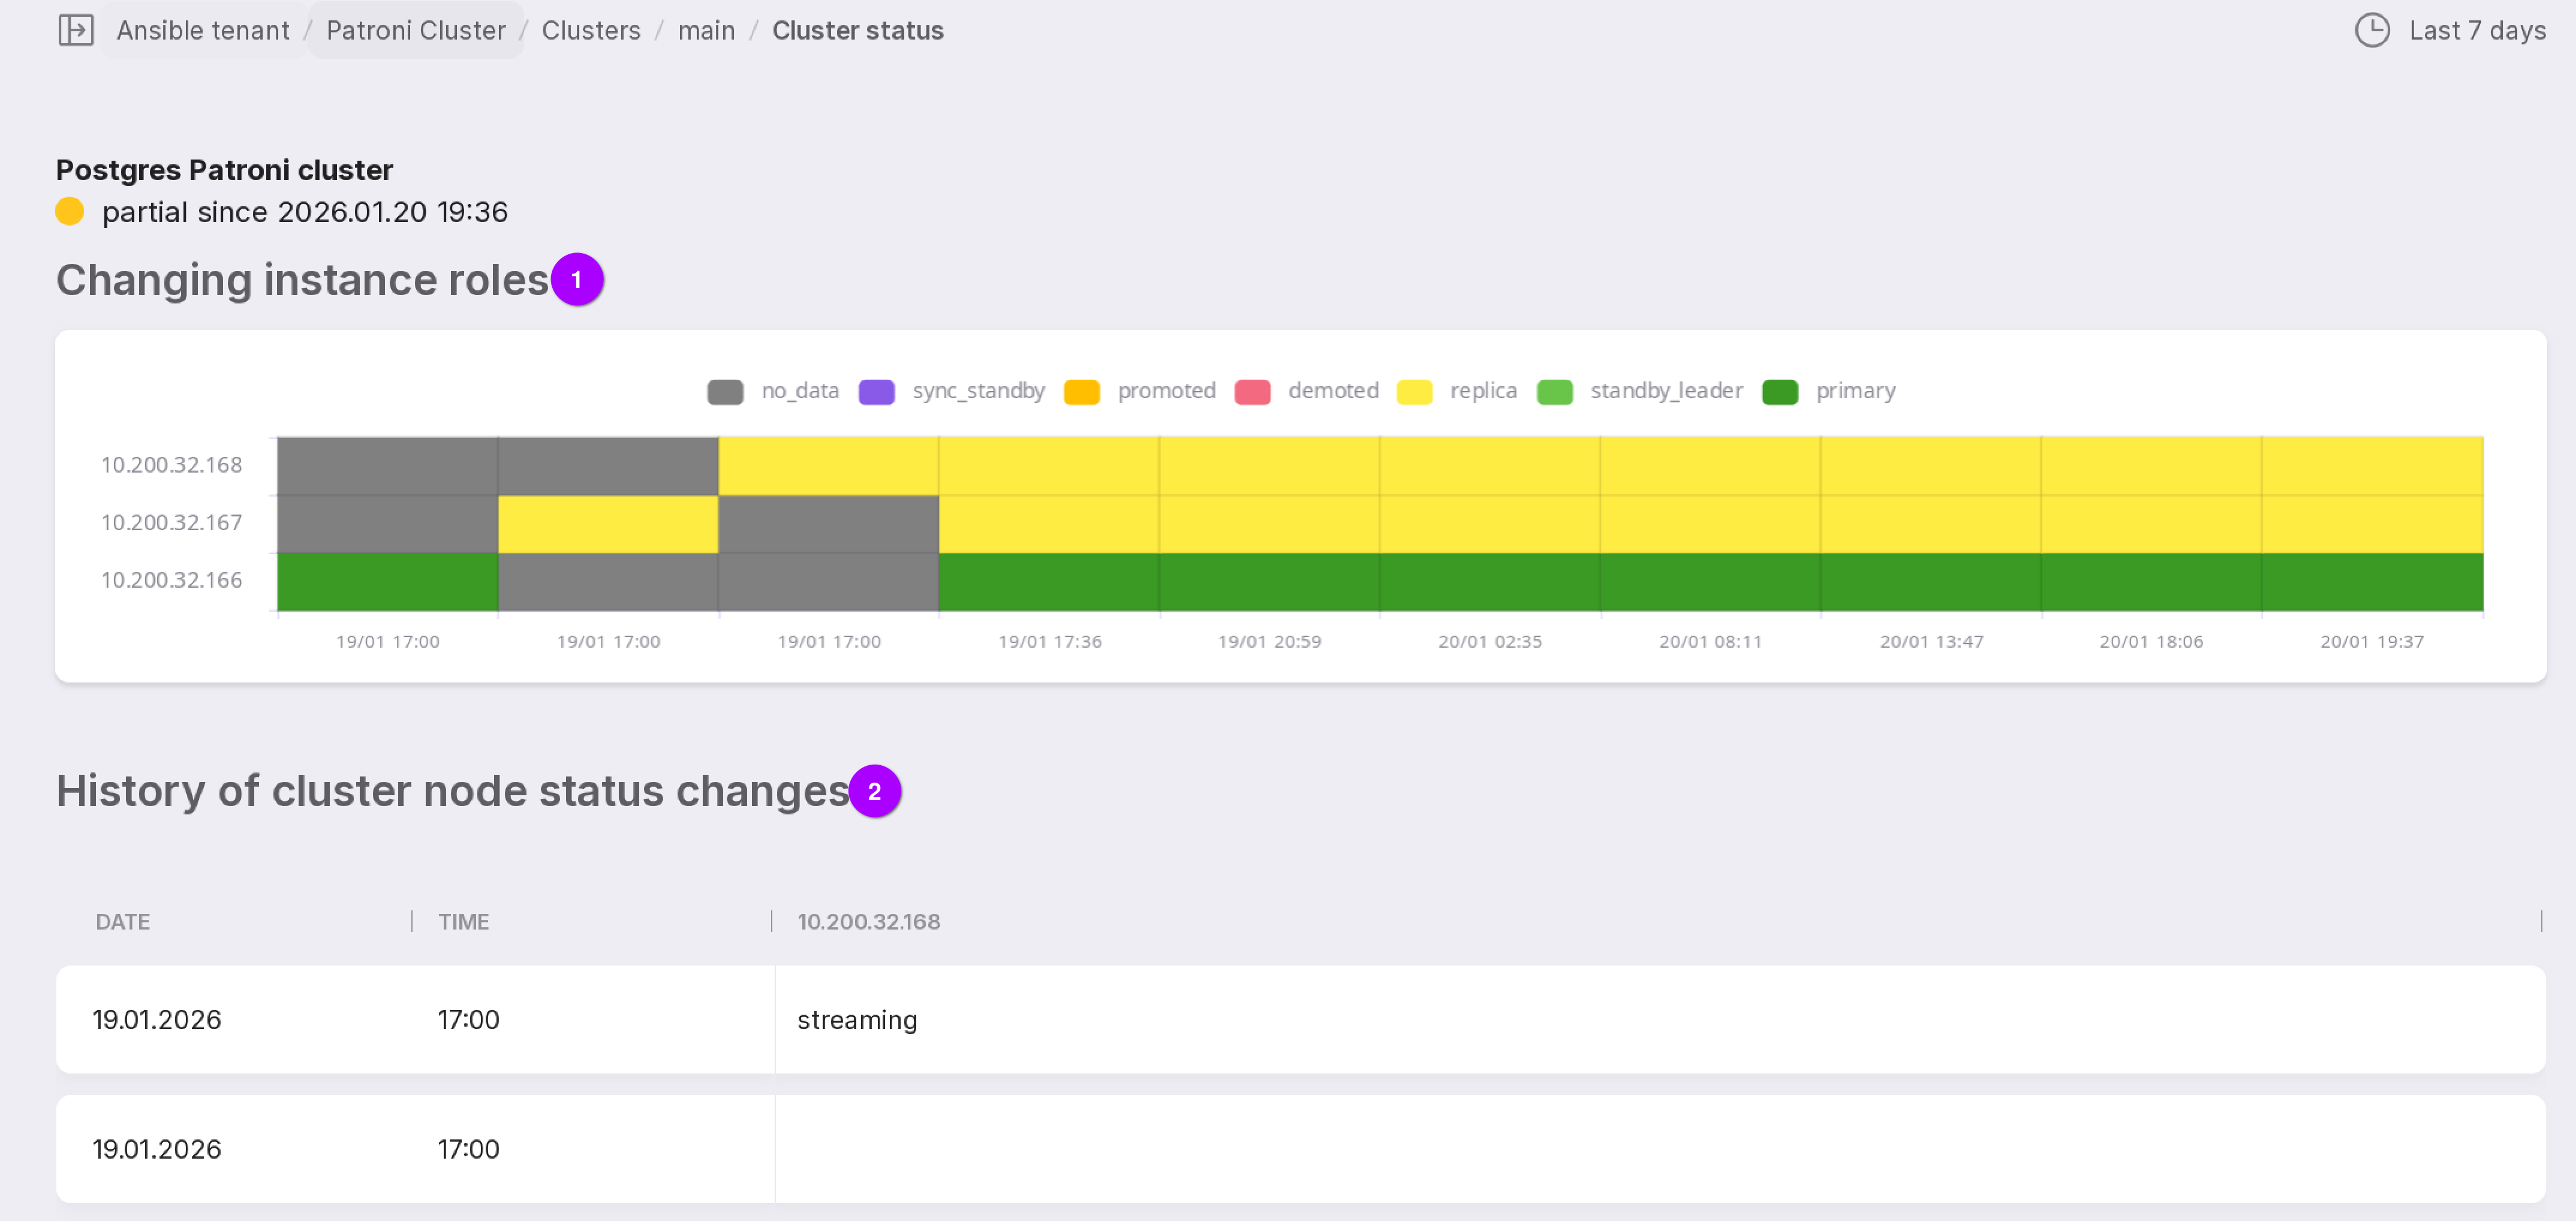
Below is a description of the information shown on the page, as numbered in the figure above:
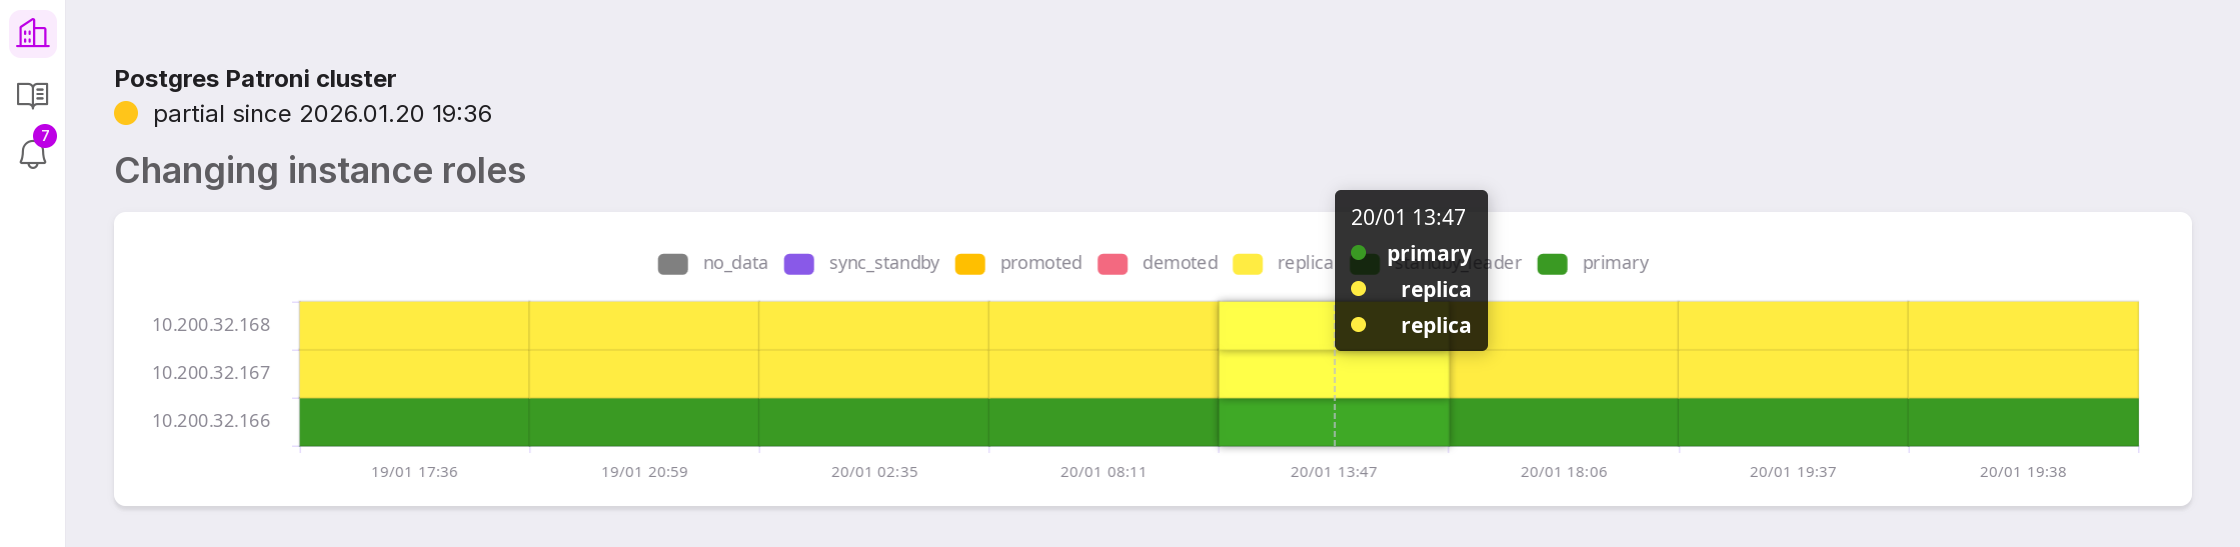
Instance Role Changes — a timeline chart illustrating the history of role transitions across cluster instances. This chart shows how instance roles (e.g., primary, replica) have evolved during the selected period. Hovering over a segment opens the roles of all instances at that specific point in time.
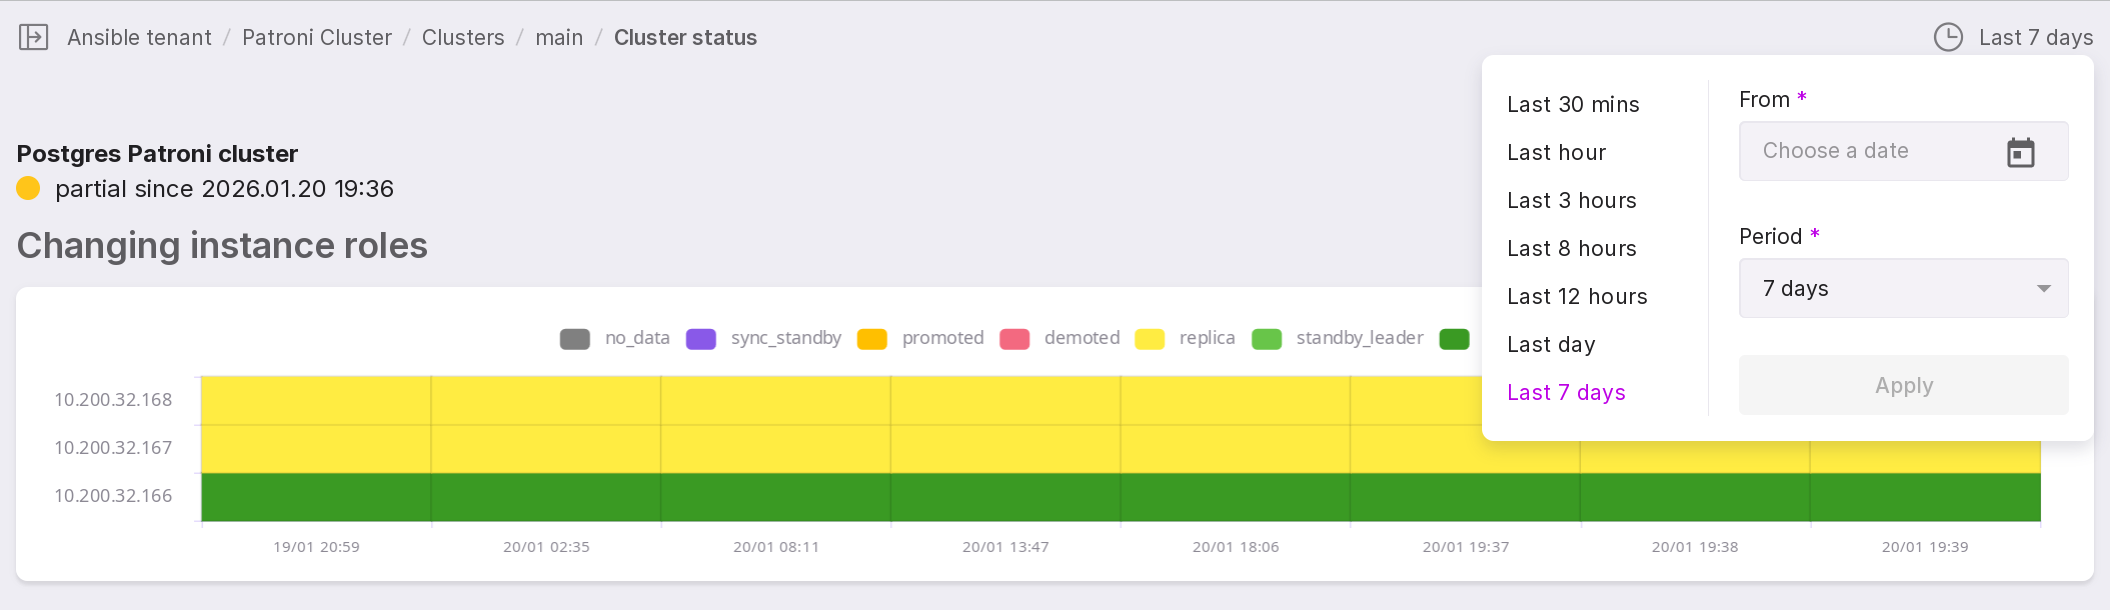
The time range and reference date (with time) can be configured in the upper-right corner of the chart.
History of cluster node state changes — a table listing historical state changes of cluster instances. It shows how the operational state of each instance has changed over the same time period selected for the role change chart above.