“Errors” section
Host selection page
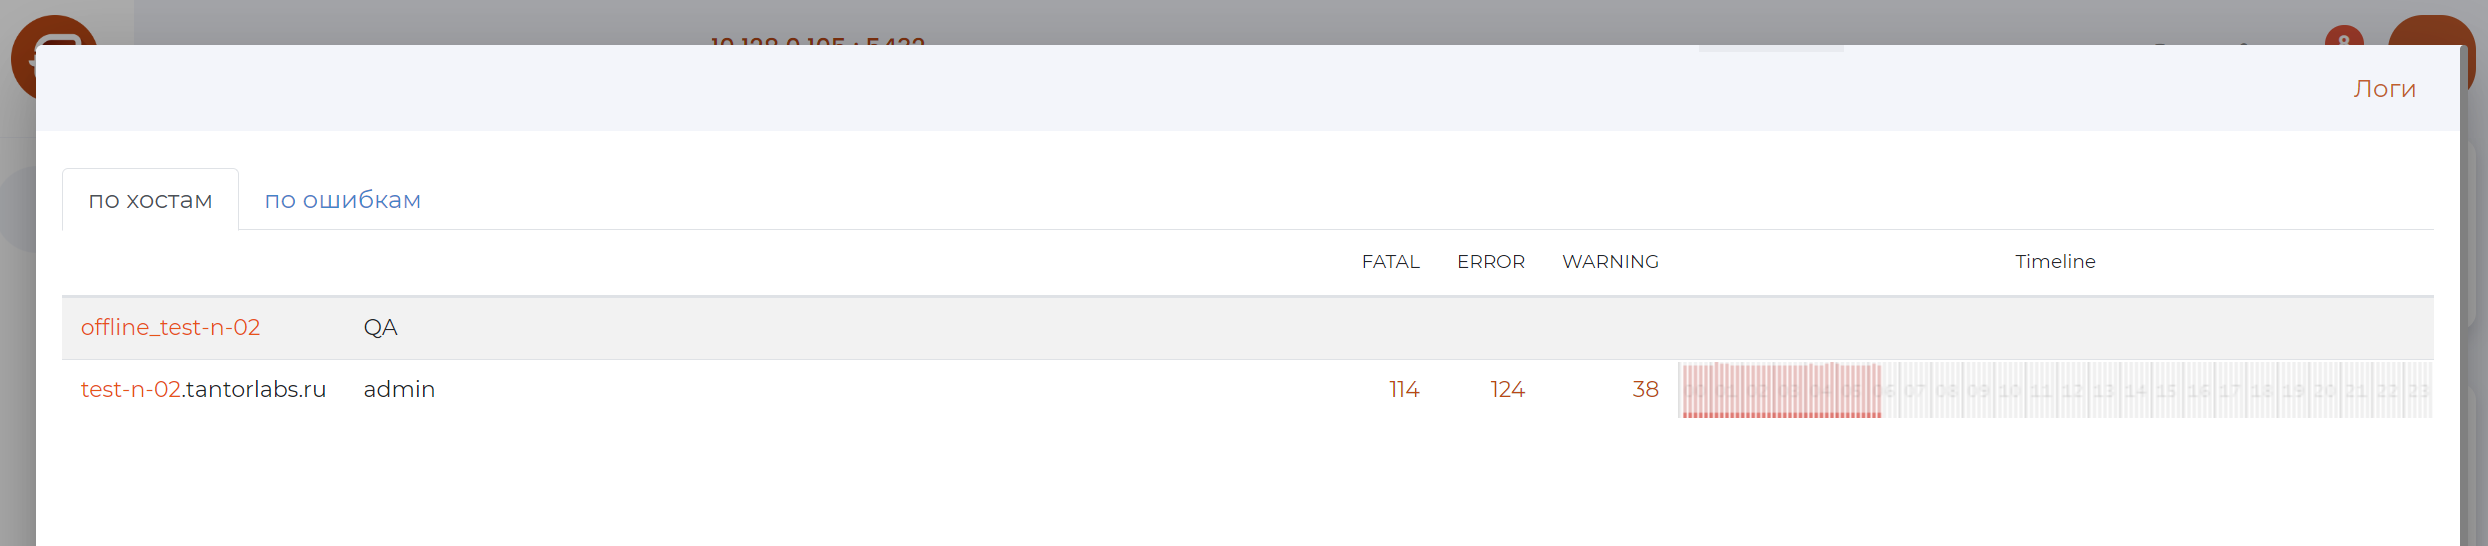
The error section contains two tabs:
By Hosts — displays a list of hosts and the number of errors of each type (FATAL/ERROR/WARNING) for the corresponding hosts.
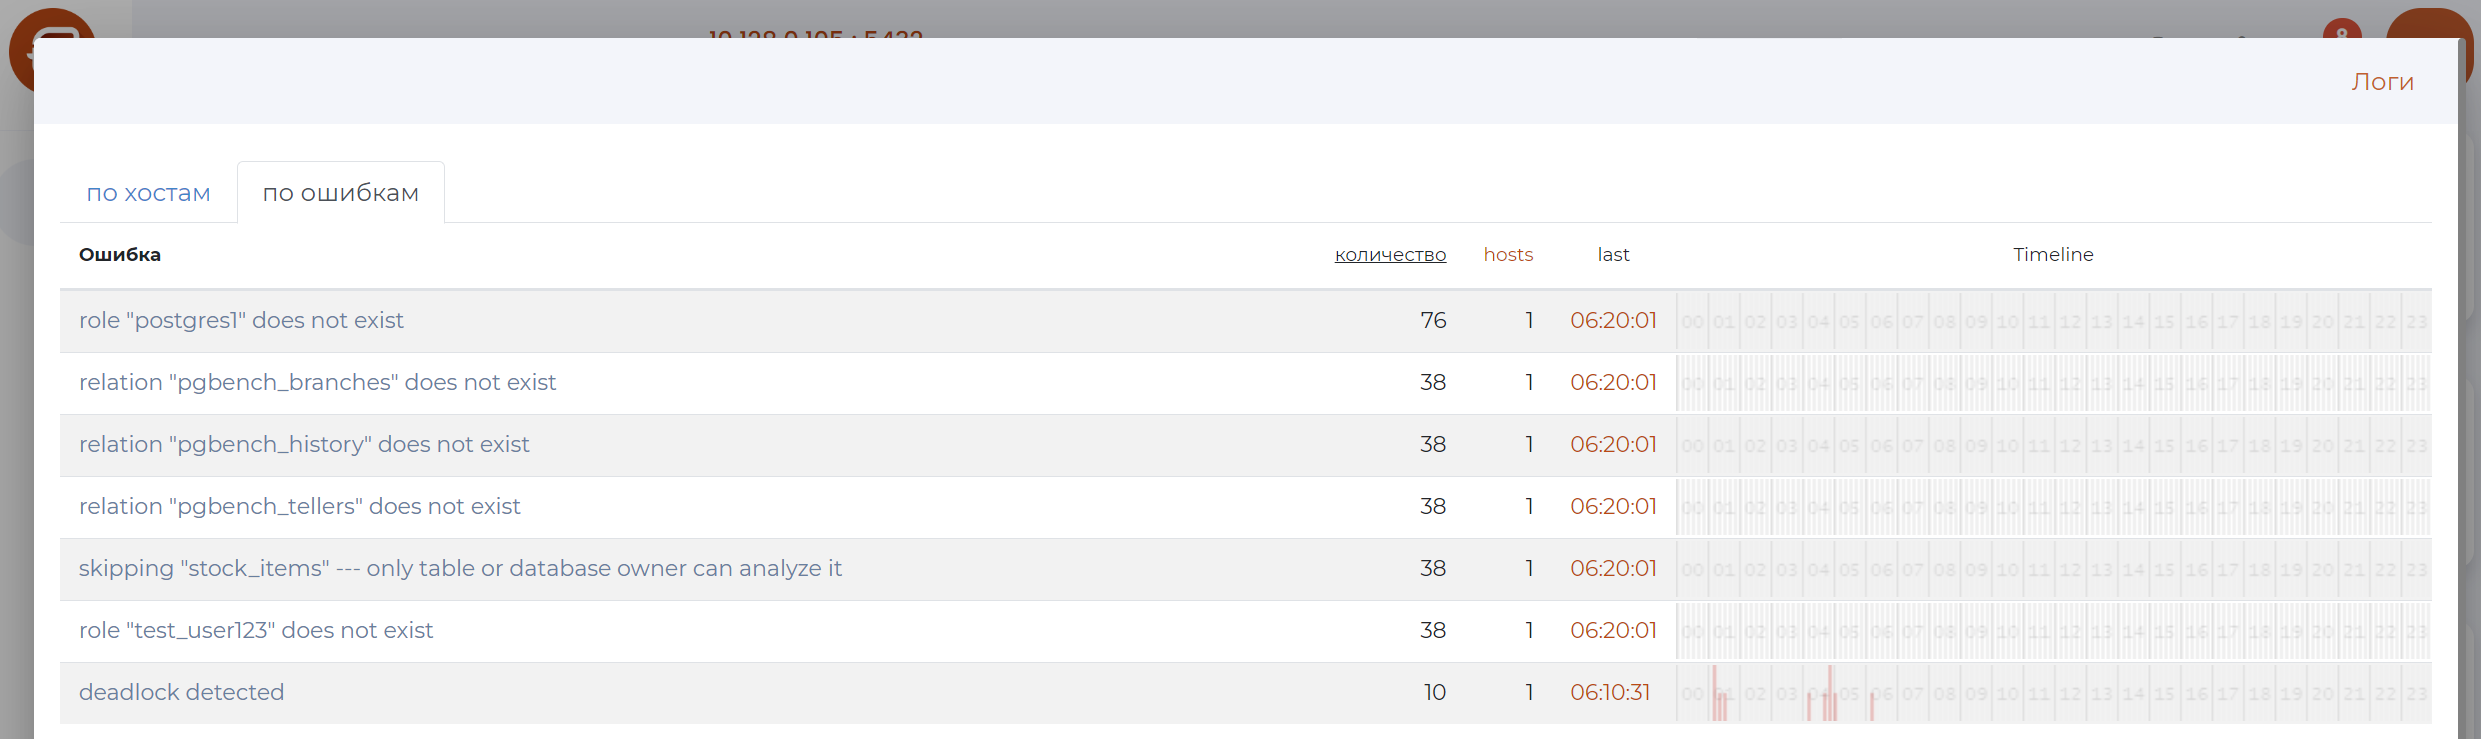
By errors — displays the following information:
name of errors;
number of errors;
the number of hosts in which they are represented;
time of the last error registration for today;
for each host, a timeline chart shows the intensity of problematic queries over a 24-hour period.
“By hosts” tab”
Page content:
#. .. include:: pg_m_glossary/pg_m_149имя_хоста.gls #. .. include:: pg_m_glossary/pg_m_148имя_ответственного.gls
3. .. include:: pg_m_glossary/pg_m_114Timeline.gls
“By errors” tab”
/ERROR, /FATAL, /WARNING pages
Page Control Panel
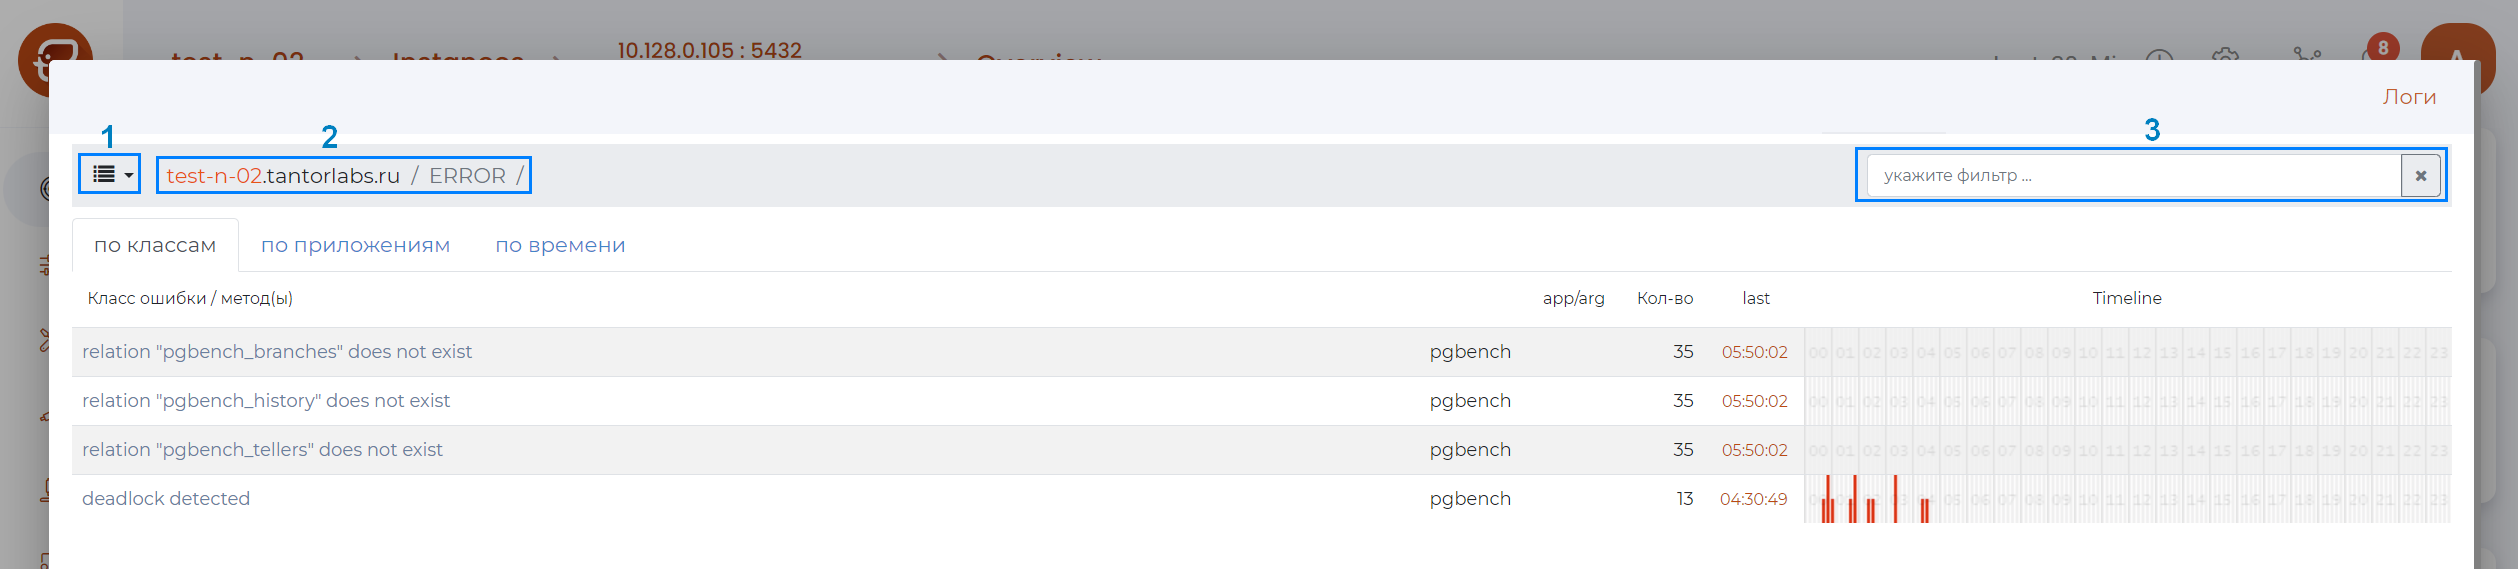
Panel composition (as numbered in the figure above):
pg_m_page_control_panel_burger-menu.
pg_m_page_control_panel_path.
pg_m_page_control_panel_filter.
“By classes” tab
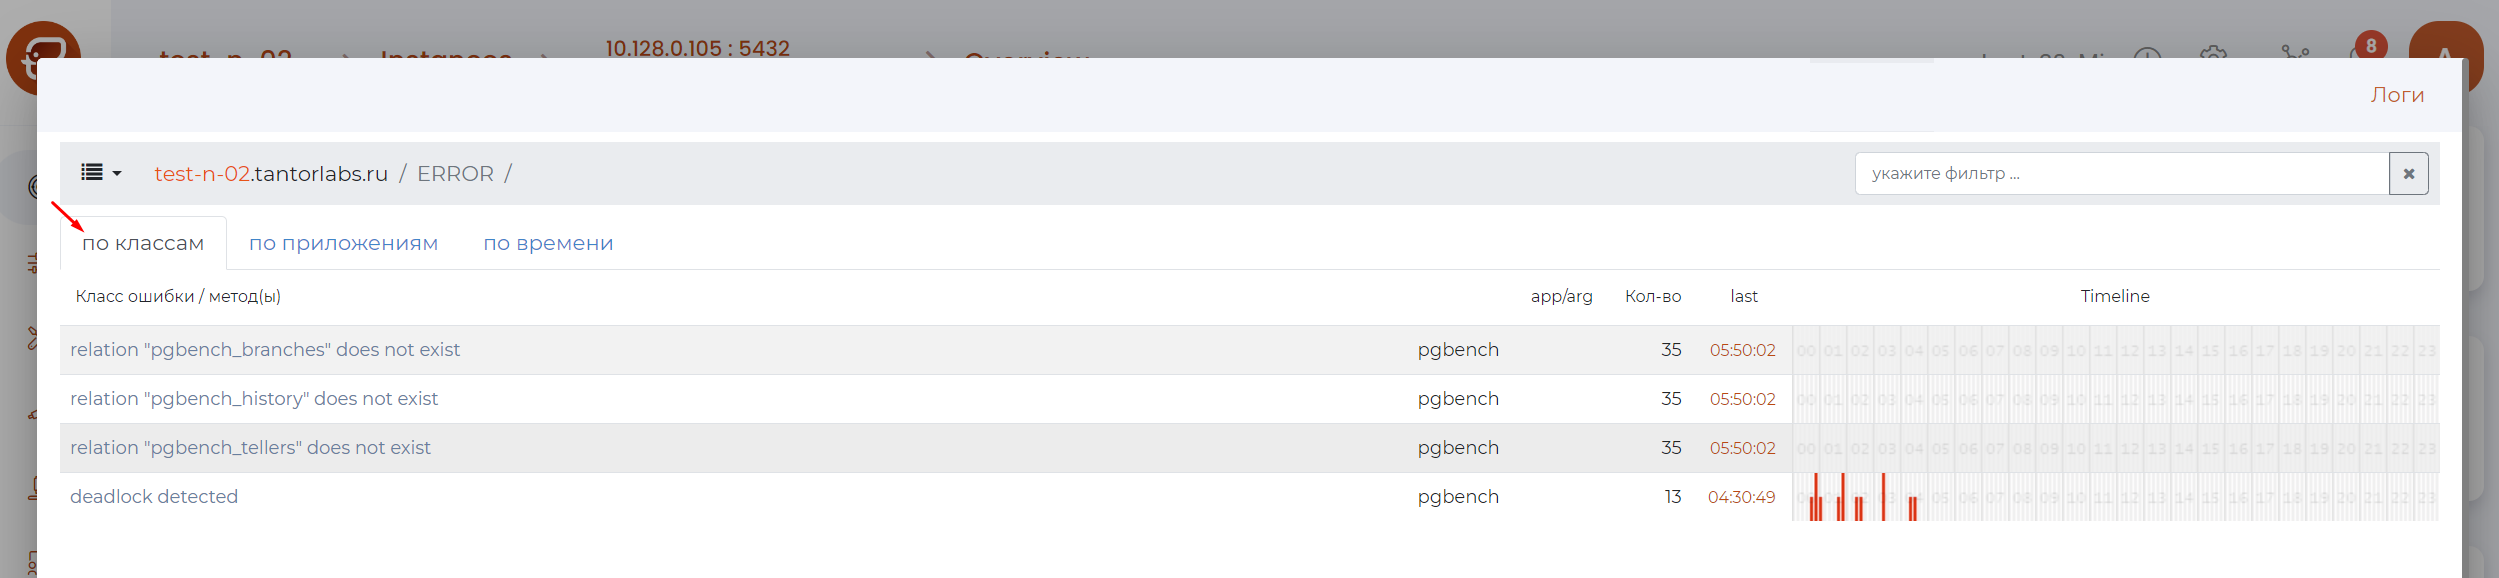
Page content:
#. .. include:: pg_m_glossary/pg_m_152Класс_ошибки_метод(ы).gls #. .. include:: pg_m_glossary/pg_m_006app_arg.gls #. .. include:: pg_m_glossary/pg_m_153кол-во.gls #. .. include:: pg_m_glossary/pg_m_052last.gls #. .. include:: pg_m_glossary/pg_m_114Timeline.gls
“By applications” tab
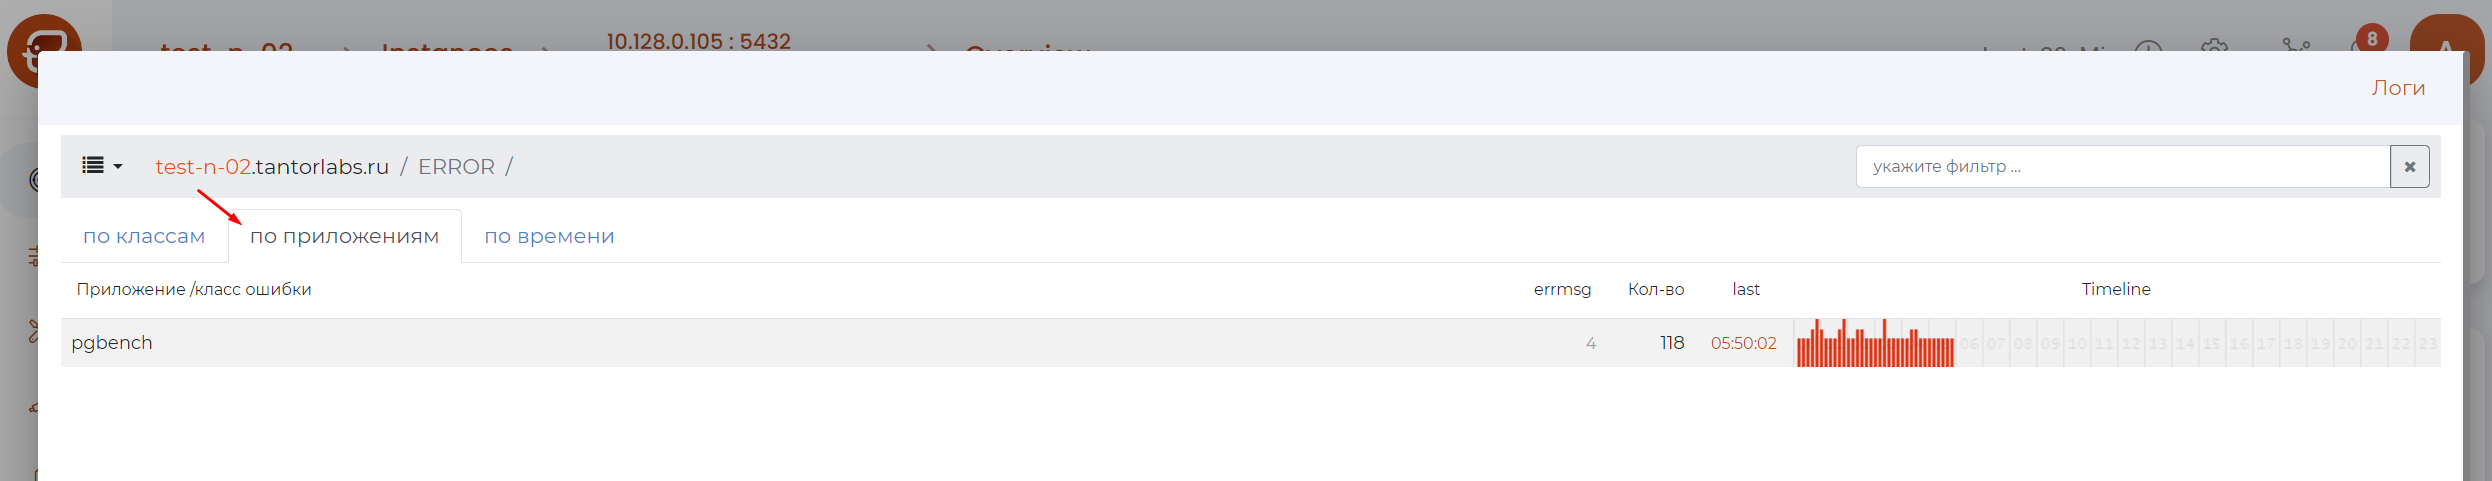
Page content:
#. .. include:: pg_m_glossary/pg_m_152Класс_ошибки_метод(ы).gls
2. .. include:: pg_m_glossary/pg_m_153кол-во.gls #. .. include:: pg_m_glossary/pg_m_052last.gls #. .. include:: pg_m_glossary/pg_m_114Timeline.gls
By Time tab
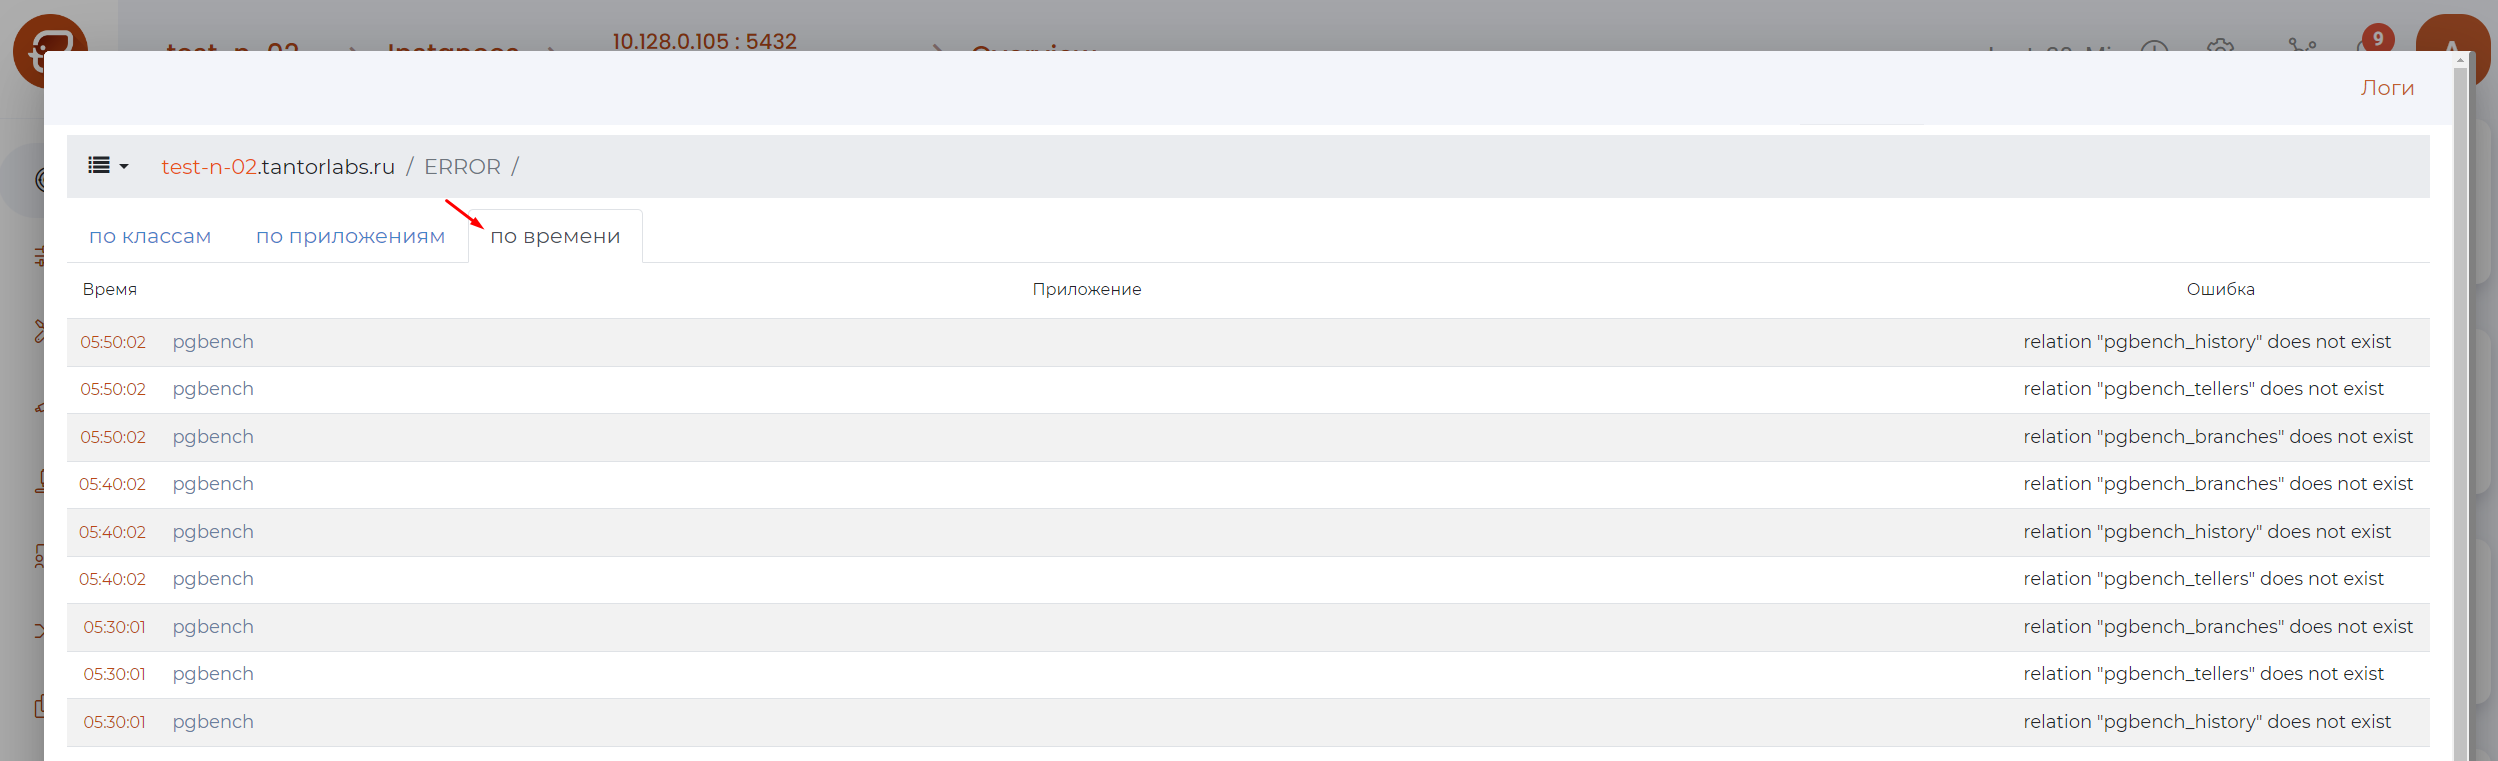
#. .. include:: pg_m_glossary/pg_m_138Время.gls #. .. include:: pg_m_glossary/pg_m_Приложение.rst #. .. include:: pg_m_glossary/pg_m_162Ошибка.gls