“Blocks” section
This section displays a summary of locks and deadlocks.
Host selection page
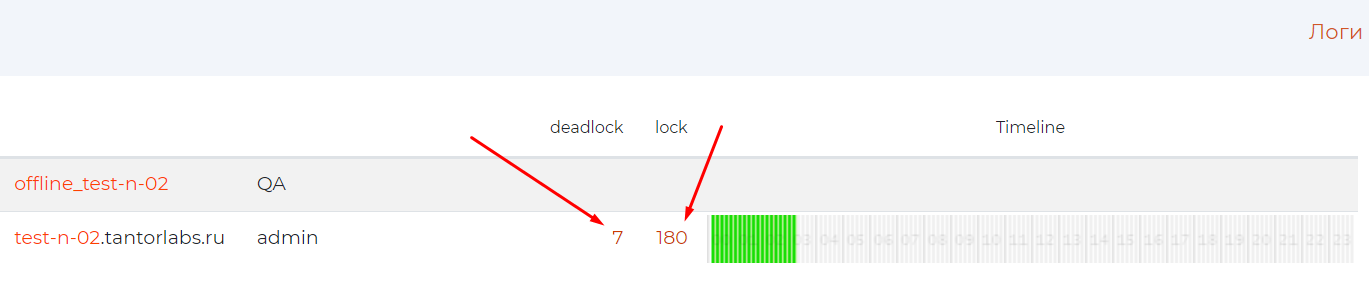
At the initial window of the locks section, there is a table with a list of databases, columns with the number of locks and deadlocks, and a graph of their occurrence frequency.
Clicking on the number of queries with locks will take you to one of the pages: /locks or /deadlocks, respectively.
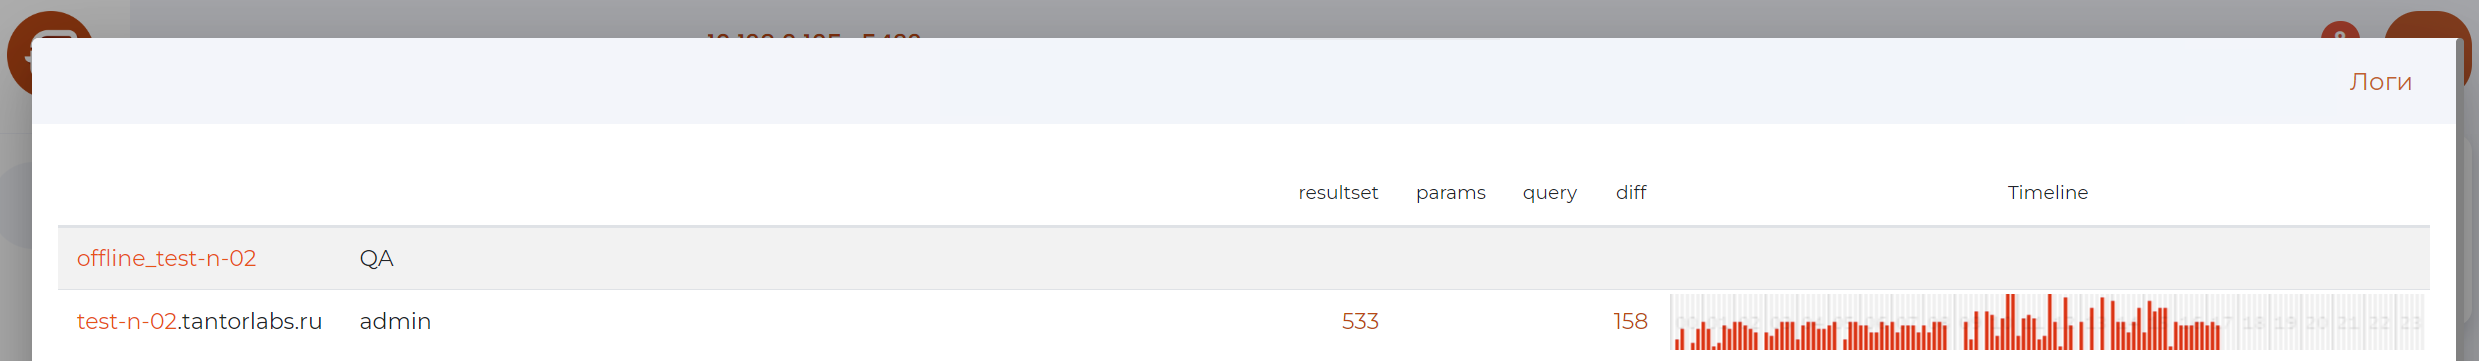
Clicking on the number of locks or deadlocks takes you to the /deadlock-detect or /lock-wait page.
Page content:
#. .. include:: pg_m_glossary/pg_m_149имя_хоста.gls #. .. include:: pg_m_glossary/pg_m_148имя_ответственного.gls #. .. include:: pg_m_glossary/pg_m_026deadlock.gls #. .. include:: pg_m_glossary/pg_m_054lock.gls #. .. include:: pg_m_glossary/pg_m_114Timeline.gls
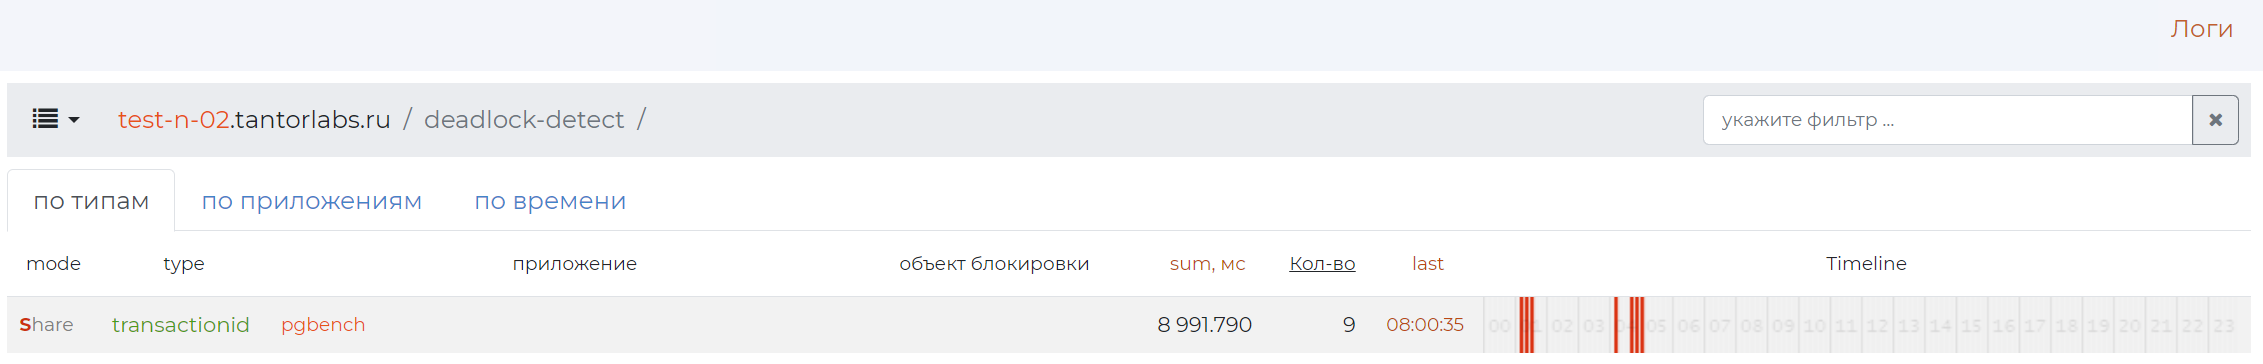
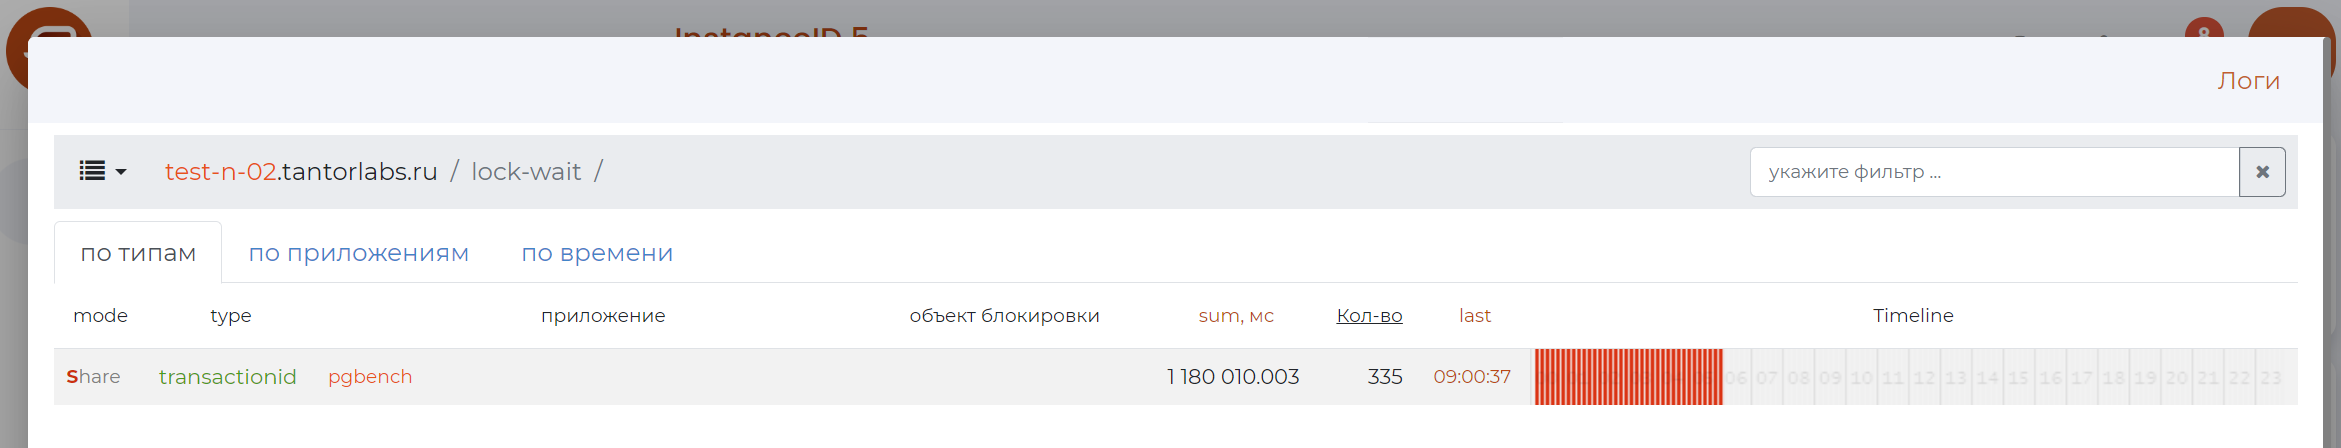
Pages /deadlock-detect, /lock-wait
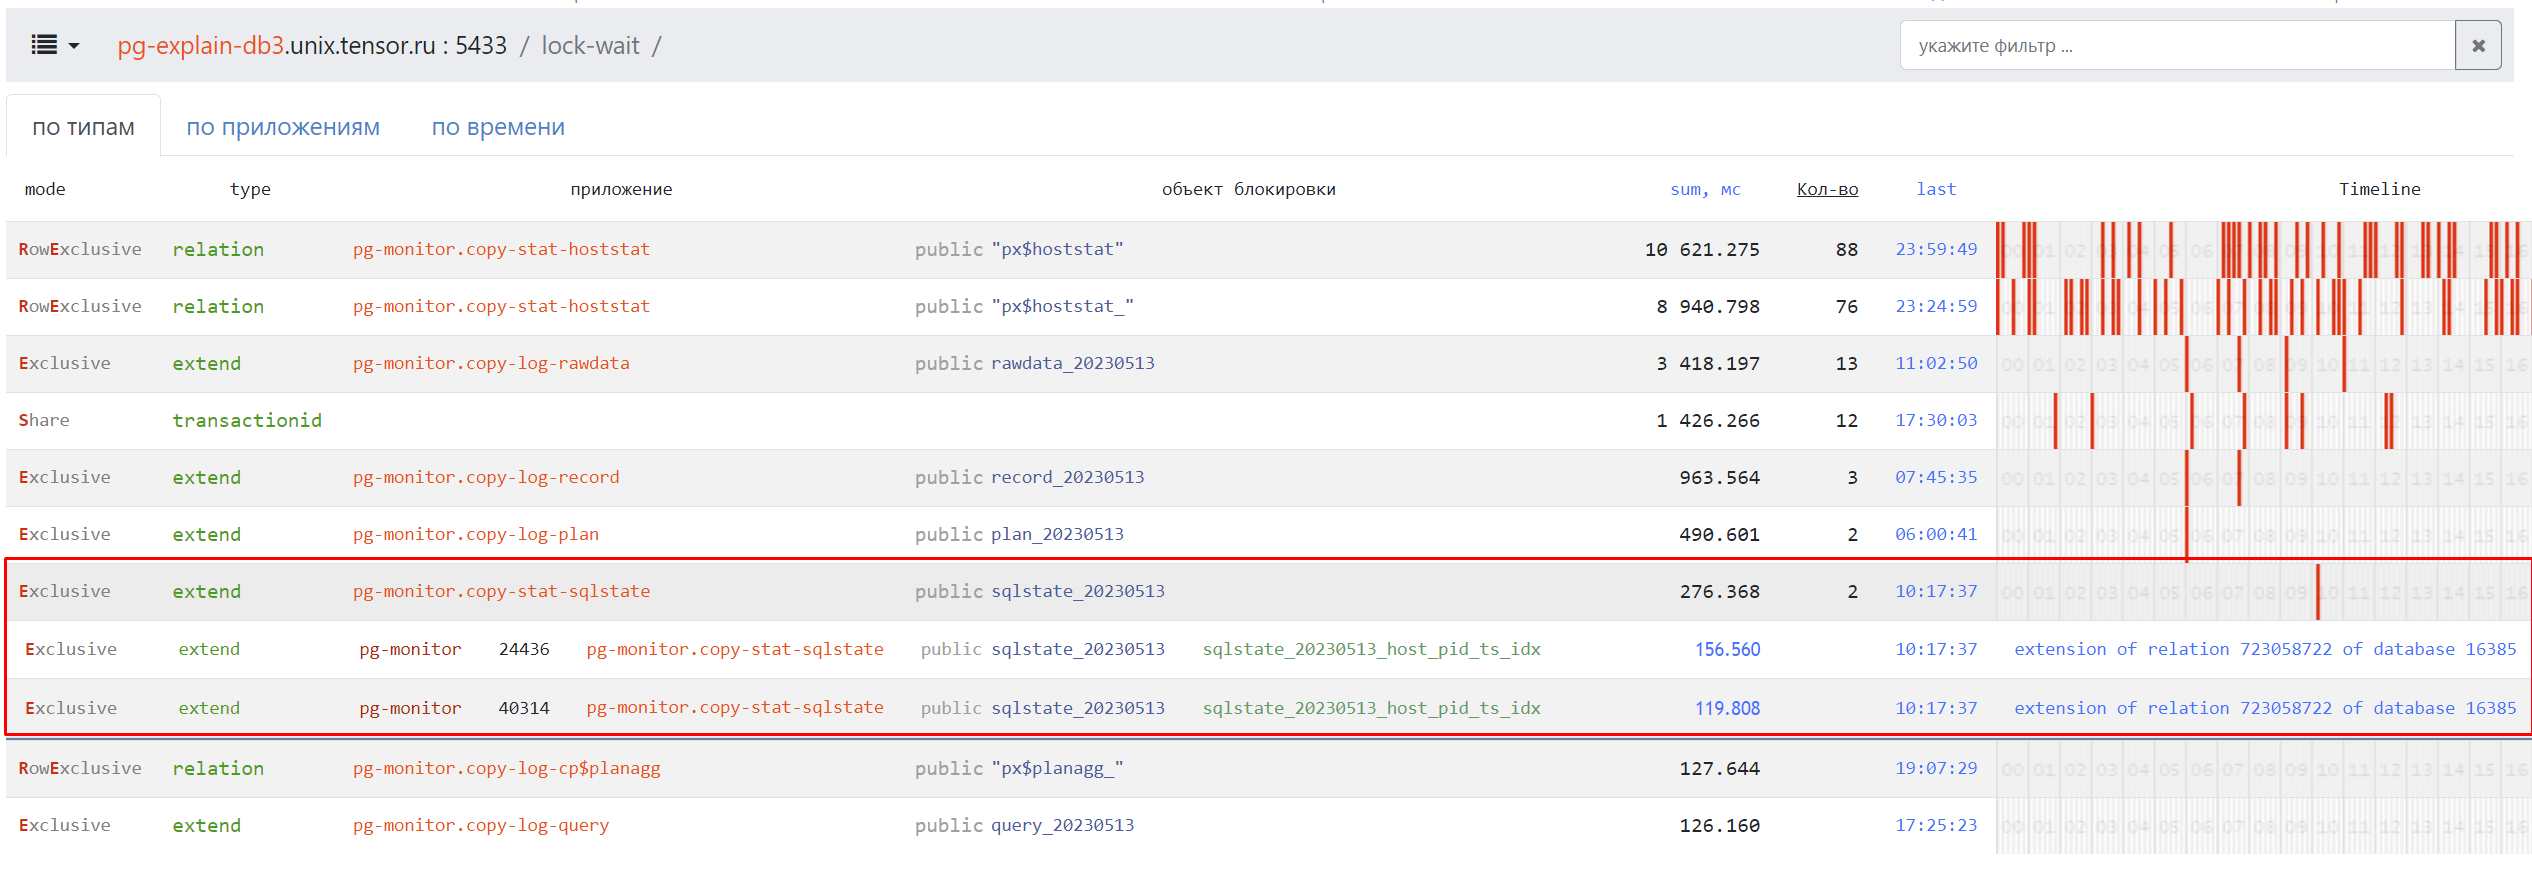
To expand the composition of queries for the tabs “by type” and “By Application” for the required application, click on its row.
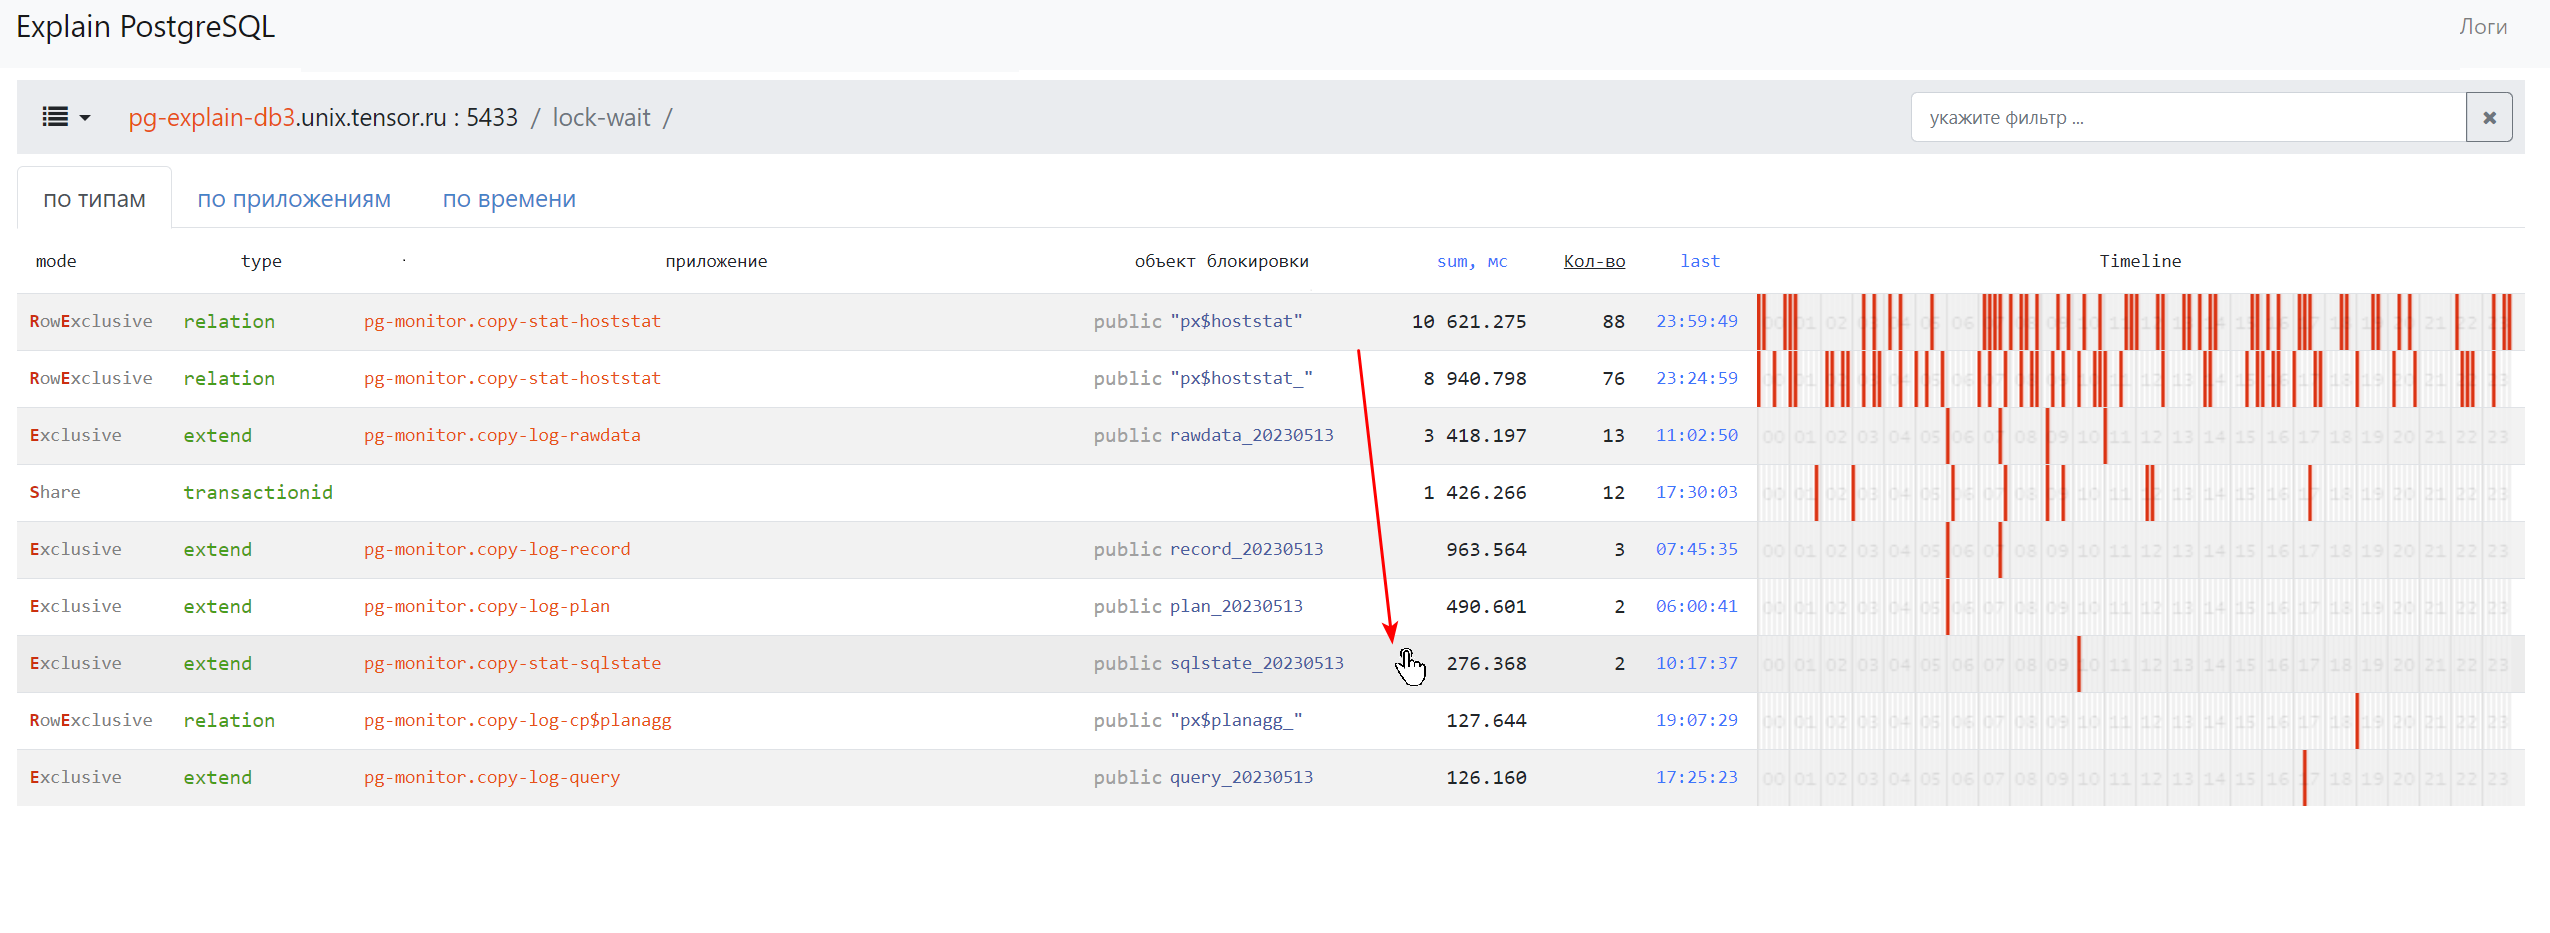
The list of queries will open.
Page Control Panel
The control panel displays the number of blocks of each type and the parameters of blocked queries. When you click on a lock group, the application and the contents of the lock object will be additionally displayed:
PID is the identifier of the database server process;
Appendix.Method.
If the entire lock group belongs to the same application, it will be reflected before the group is expanded.
“By type” tab
This tab shows the number of blocks each application has and the settings for blocked queries. When you click on a lock group, the composition of the lock object will be additionally displayed:
PID is the identifier of the database server process;
Appendix.Method.
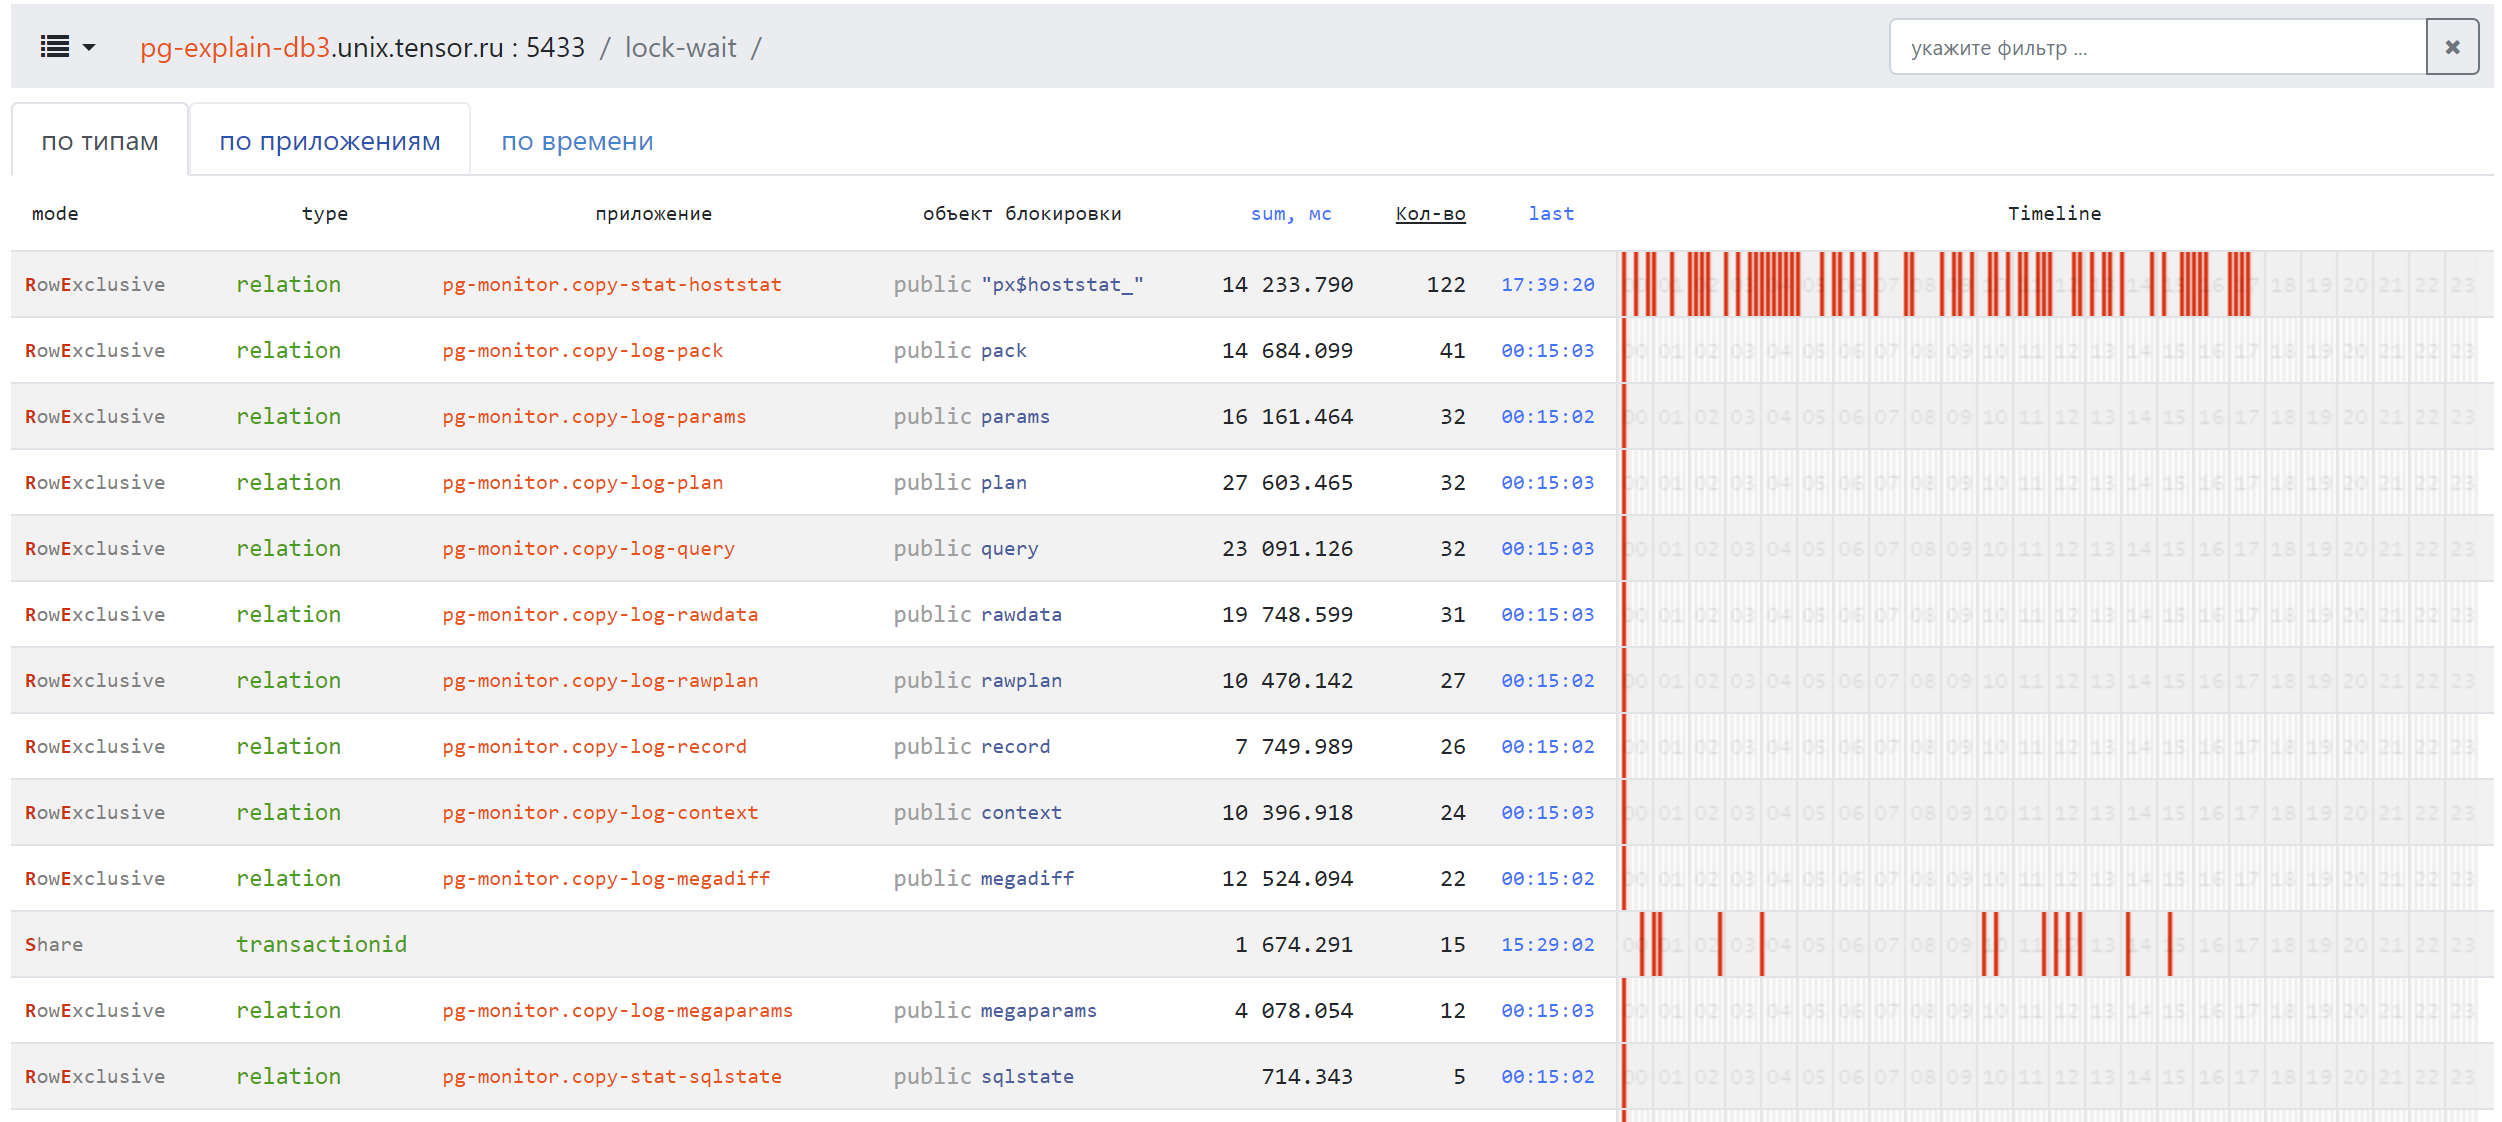
Page content:
#. .. include:: pg_m_glossary/pg_m_062mode.gls #. .. include:: pg_m_glossary/pg_m_123_1type_блокировки.gls #. .. include:: pg_m_glossary/pg_m_165_1приложение-блокировки.gls #. .. include:: pg_m_glossary/pg_m_161объект_блокировки.gls #. .. include:: pg_m_glossary/pg_m_101sum_мс.gls #. .. include:: pg_m_glossary/pg_m_153кол-во.gls #. .. include:: pg_m_glossary/pg_m_052last.gls #. .. include:: pg_m_glossary/pg_m_114Timeline.gls
“By applications” tab
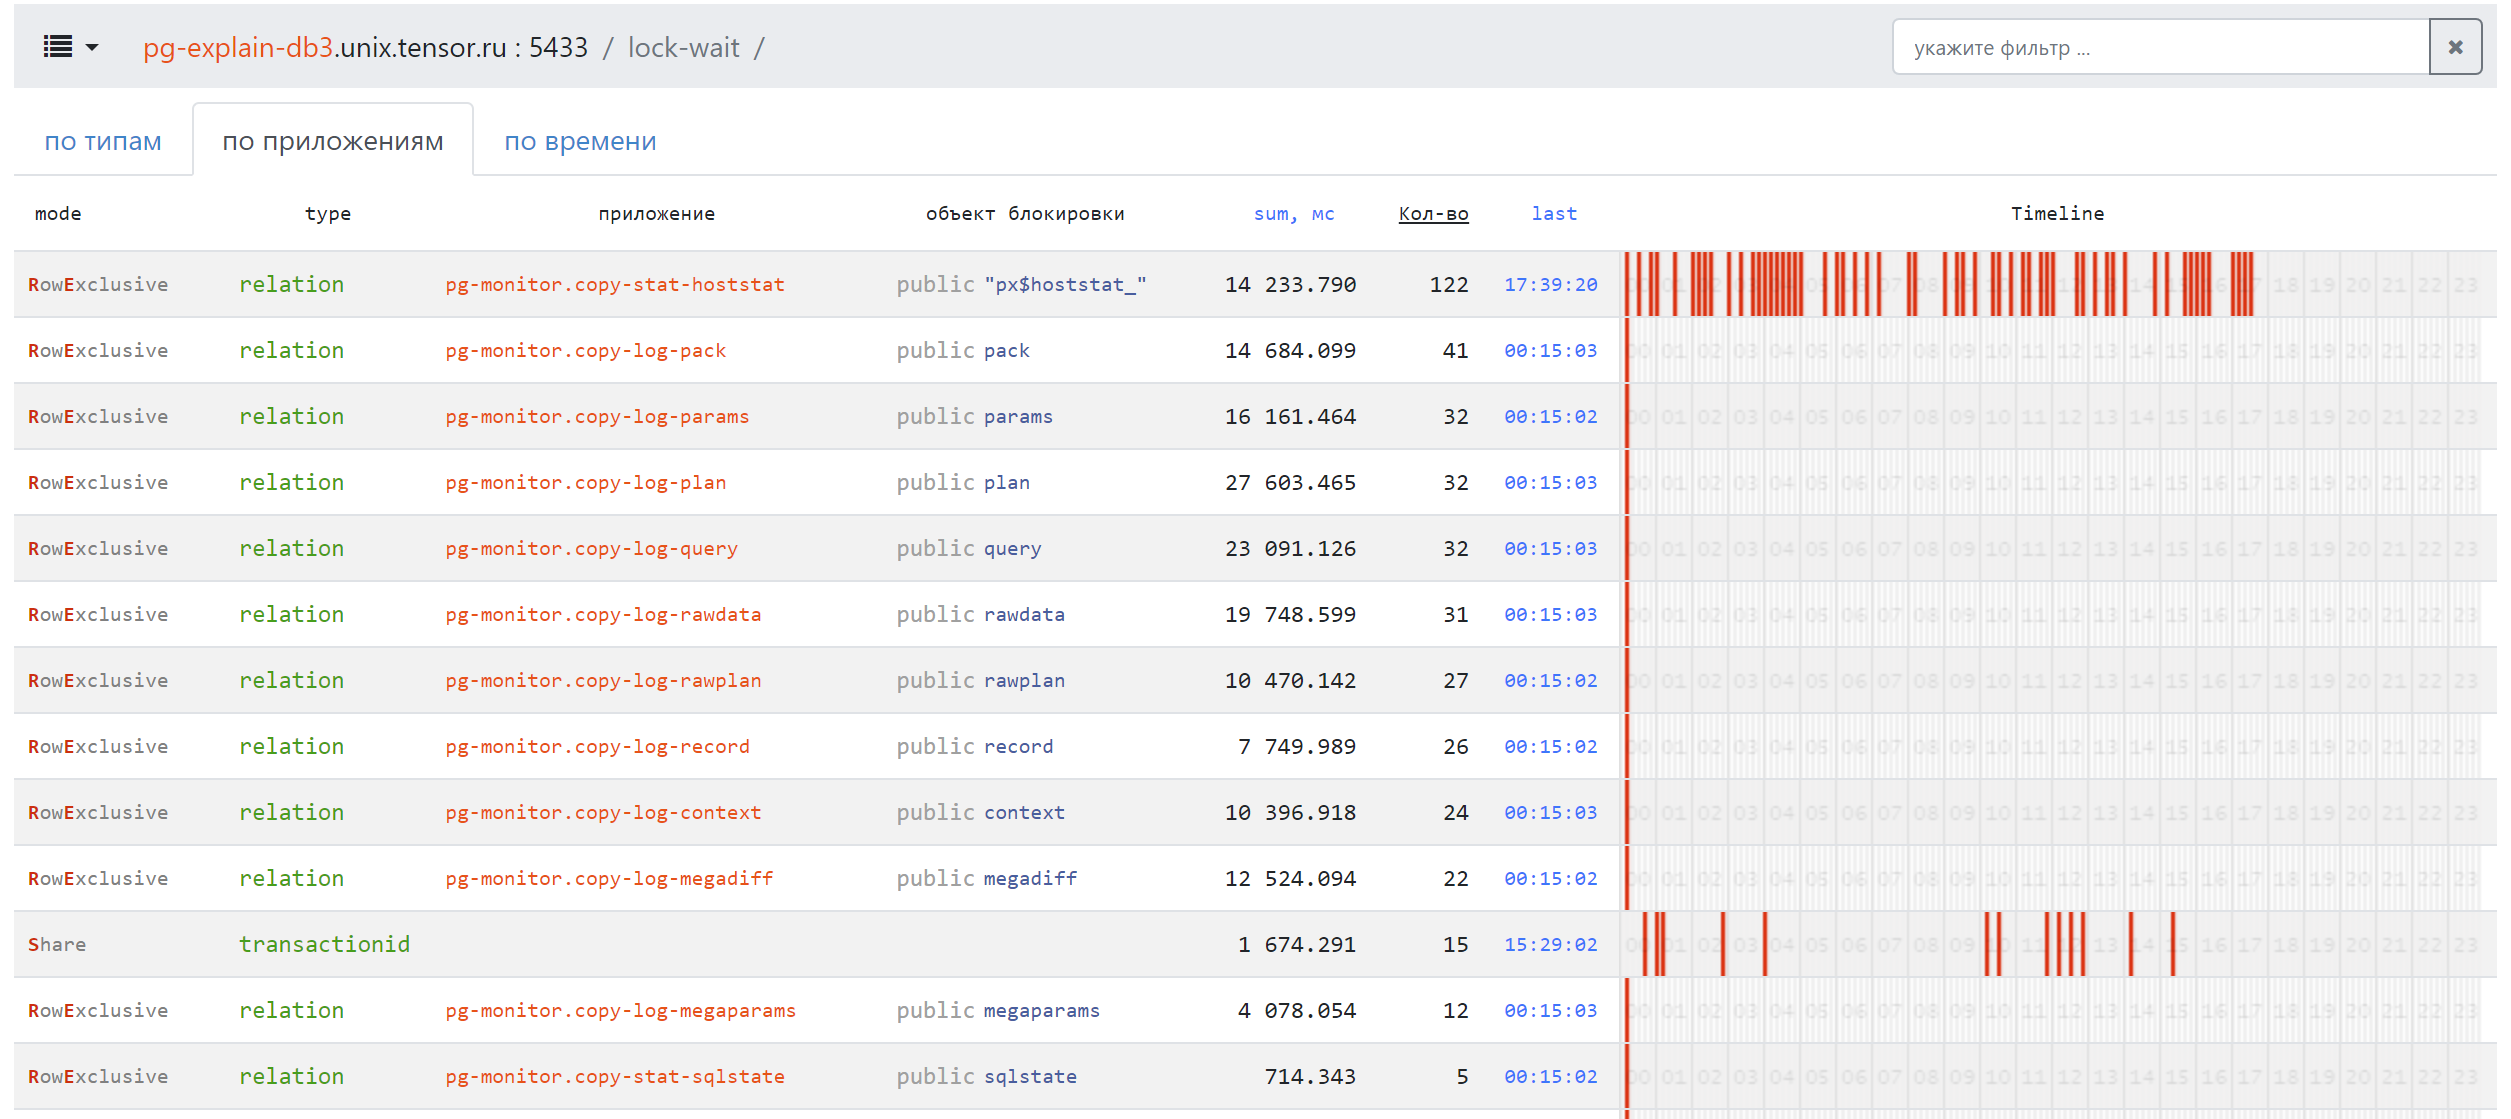
Page content:
#. .. include:: pg_m_glossary/pg_m_062mode.gls #. .. include:: pg_m_glossary/pg_m_123_1type_блокировки.gls #. .. include:: pg_m_glossary/pg_m_165_1приложение-блокировки.gls #. .. include:: pg_m_glossary/pg_m_161объект_блокировки.gls #. .. include:: pg_m_glossary/pg_m_101sum_мс.gls #. .. include:: pg_m_glossary/pg_m_153кол-во.gls #. .. include:: pg_m_glossary/pg_m_052last.gls #. .. include:: pg_m_glossary/pg_m_114Timeline.gls
“By time” tab
This tab displays all locks in chronological order without any grouping. For each block, the following will be displayed:
Start Registration Time, End Date and Time, and Total Lock Time;
type of blocking;
PID, application and method.