General information on query plans
Query plan is required to figure out which node in the query tree is the weakest link. For example, a node that caused a query to take a very long time to execute or unequal resource allocation. There are two commands in the SQL language that invoke the query plan:
EXPLAIN <query_text> - builds the outline of the query itself. The result of this command does not change depending on the number of times it is run. It depends only on the data distribution statistics in your database. Shows only the planned values, without executing the query.
EXPLAIN ANALYSE <query_text> - directly executes the query and analyses it. Shows the planned and actual values of the executed query. If the actual and planned query results differ significantly, it means that the statistics is not up to date and you need to adjust it.
You can hide the information on a particular parameter in the result of an explain analysis by writing SQL <some_parameter> = OFF in the query.
In general terms, the result of executing such a command returns the names of the nodes (underlined in green in the figure below) of the written query and the “cost” of each such query (cost, indicated by the number 1 in the figure below). Accordingly, the plan that has smaller cost wins. The cost is returned depending on the given parameters, which can be: cost per atomic operation in terms of CPU, cost of retrieving one record, etc. The following metrics are also returned (all provided on a per-node basis):
query execution time (actual time - number 4 in the figure below);
the number of loops to pass through some node (loops - number 5 in the figure below);
the length of the data retrieved by the query - the number of rows (“rows” is number 2 in the figure below);
width of the data retrieved by the query - the size of these rows in bytes (“width” is number 3 in the figure below).
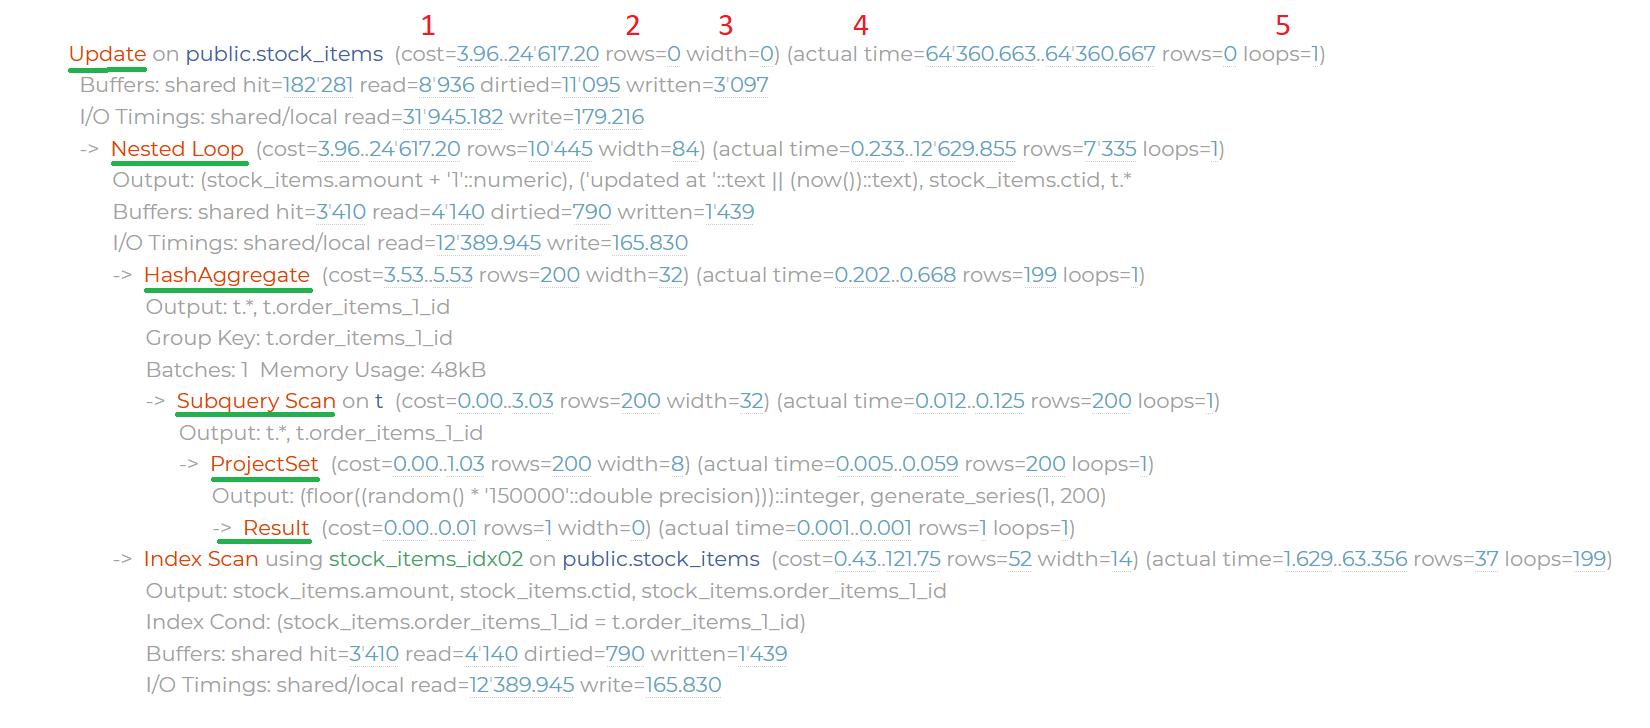
Fig. 1 Example of an SQL query plan
You can configure Postgres to not choose to run queries through certain nodes (SET <node name, e.g. Index Scan> = OFF).
To see what settings are being used now, you need to write “explain settings” in SQL.
Depending on what syntax and content the query has, we will get different node names and keywords (Result, Values Result, Function Scan, Filter, Sec Scan, Index Scan, Custom Scan, Bitmap Heap Scan, etc.).