Section “Logs”
With this section, you can monitor queries by PID, host, or a combination of both, taking into account the time filter.
Example: The cause of a problematic query is a lock and you want to find the source of the lock.
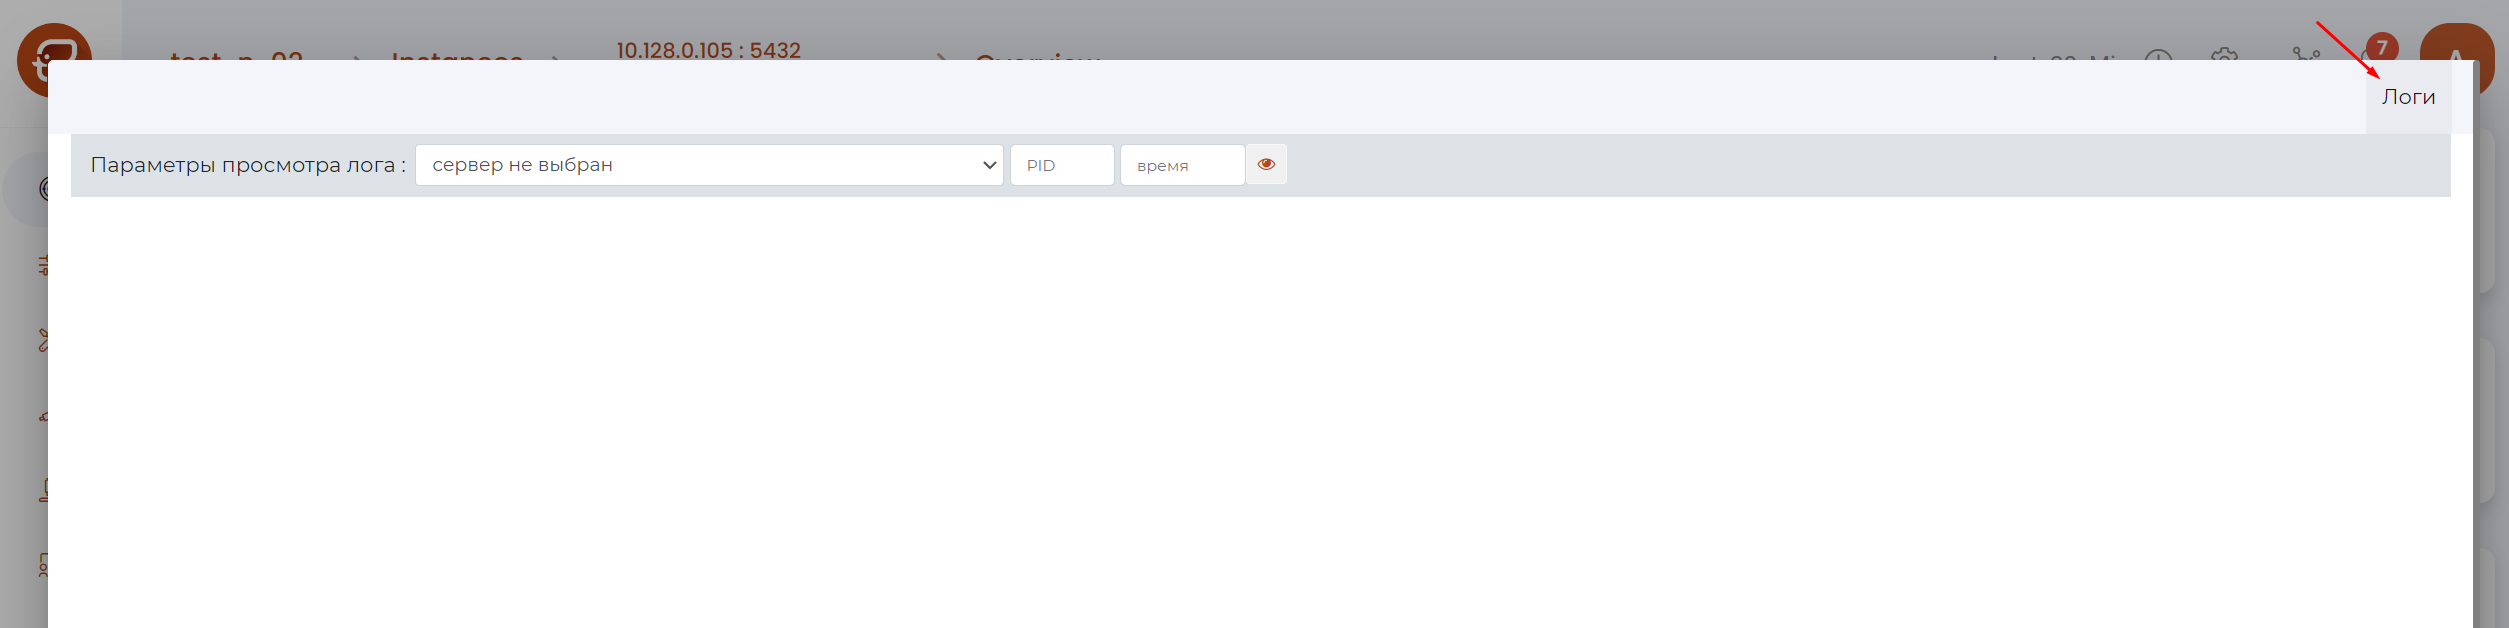
Page Control Panel
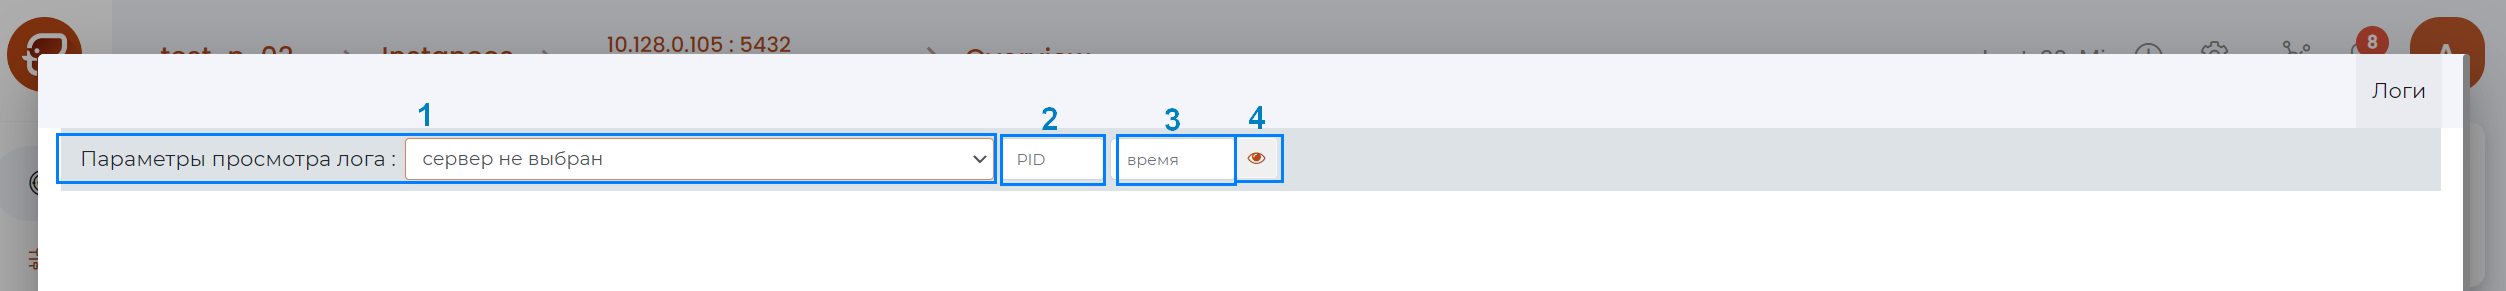
Panel composition (as numbered in the figure above):
Host selection field — opens the menu:
Field for entering PID.
A field for time.
Button to display/update the displayed logs.
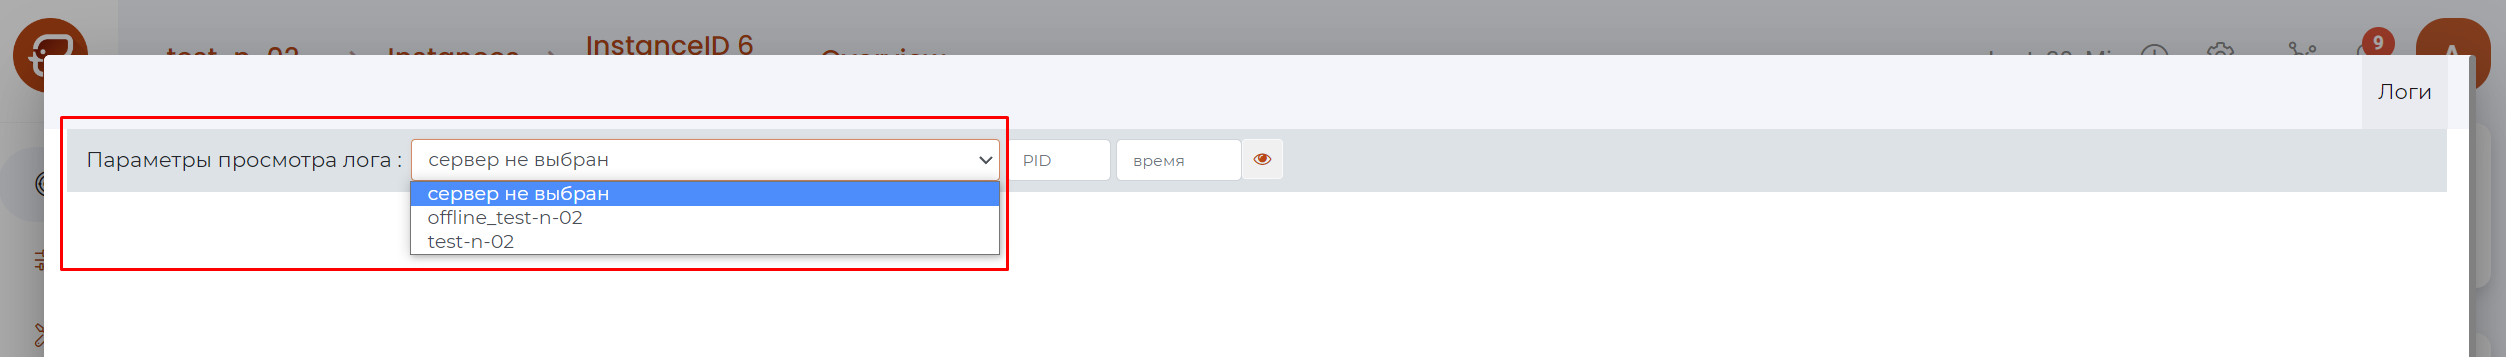
Selecting logs to view
The procedure for selecting logs for viewing:
Select a host from the drop-down list.
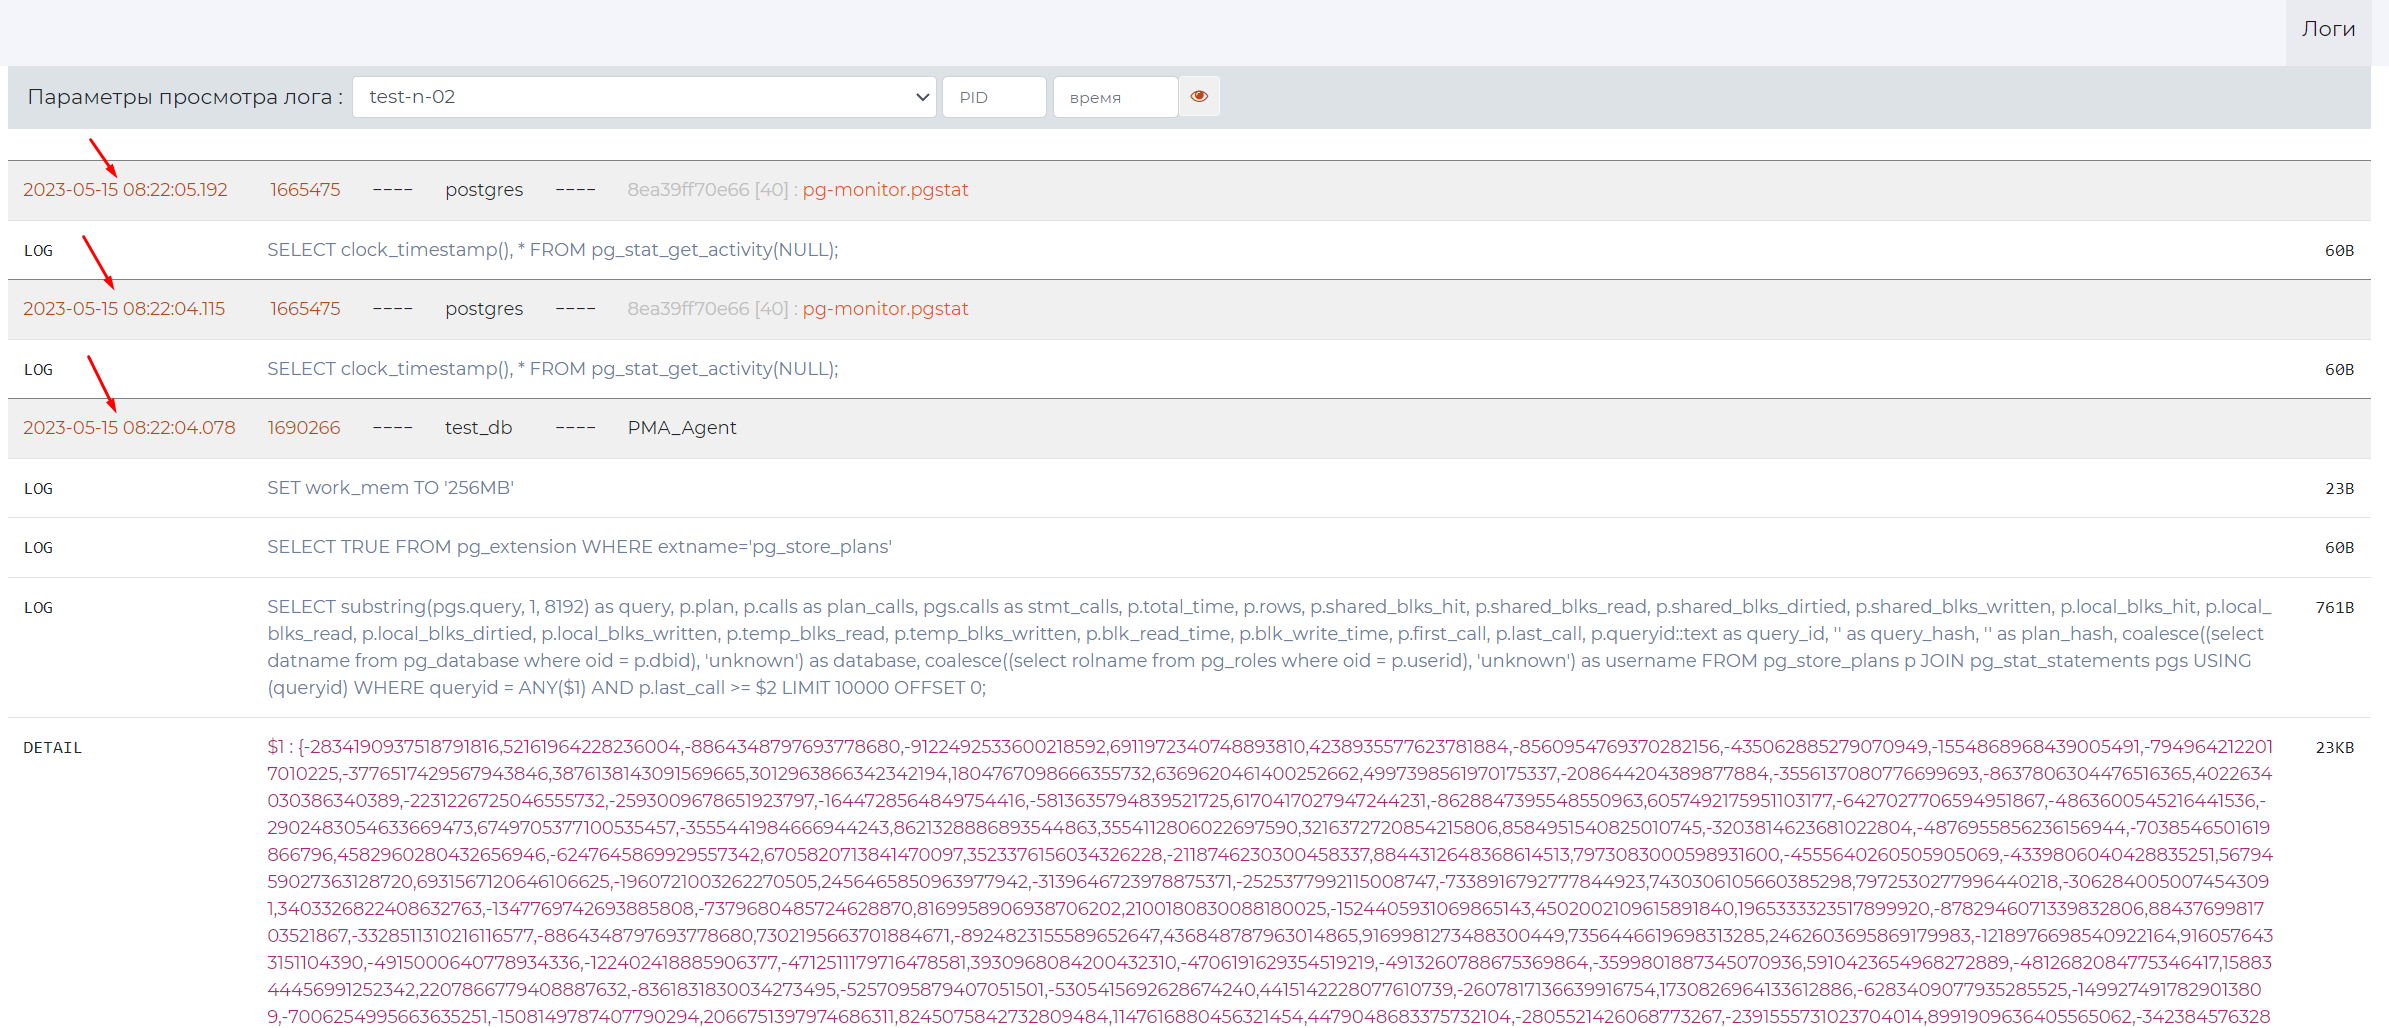
A list of records for this host will be displayed;
Enter the PID. #. Enter the time.