Pages /params, /query, /resultset
Using this page, you can monitor the size of the query body, the parameters passed to the query, the sample returned, and the time variance between the execution time and the client time.
For queries exceeding 1 MB of incoming or outgoing traffic, the module will provide:
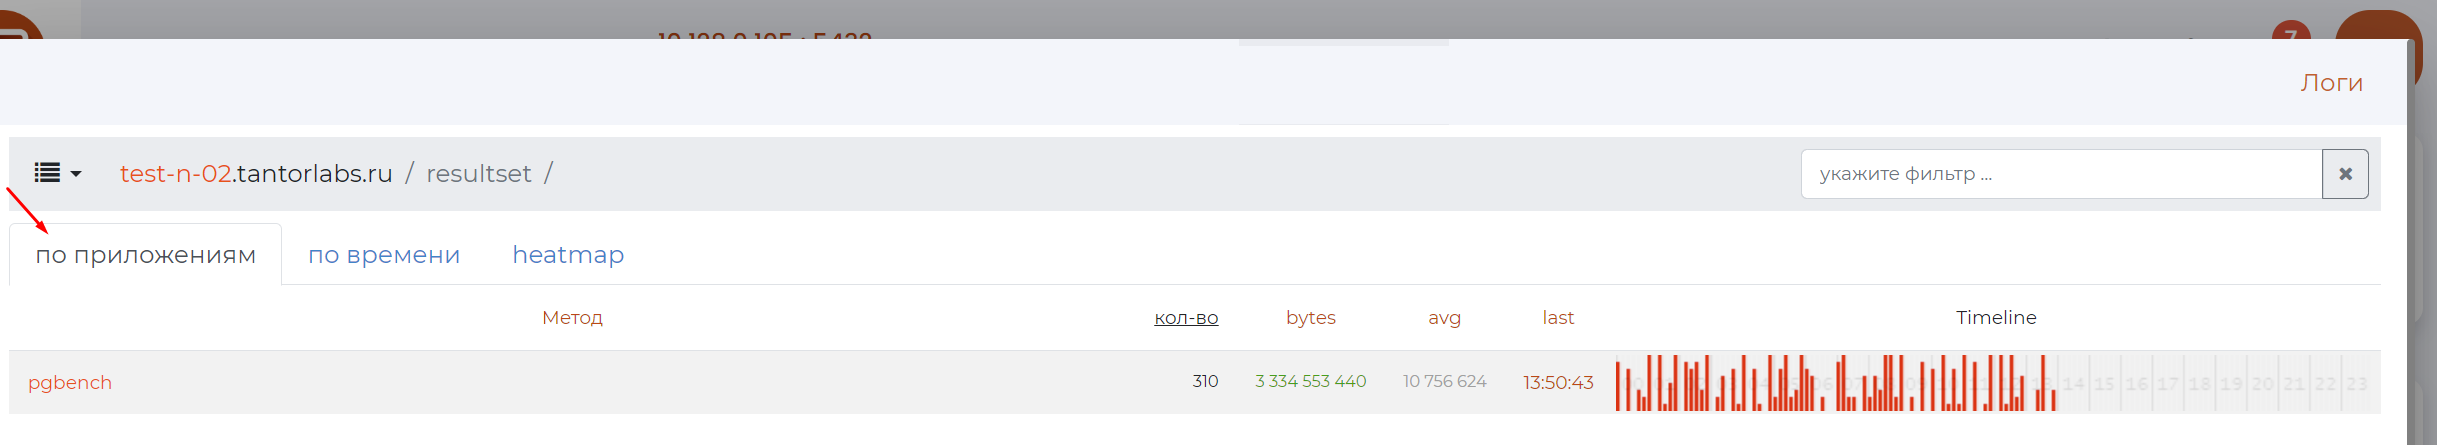
a summary of query metrics aggregated by :ref:’by application <pg_m_Мегазапросы_p_q_r_по_приложениям>’;</pg_m_Мегазапросы_p_q_r_по_приложениям>
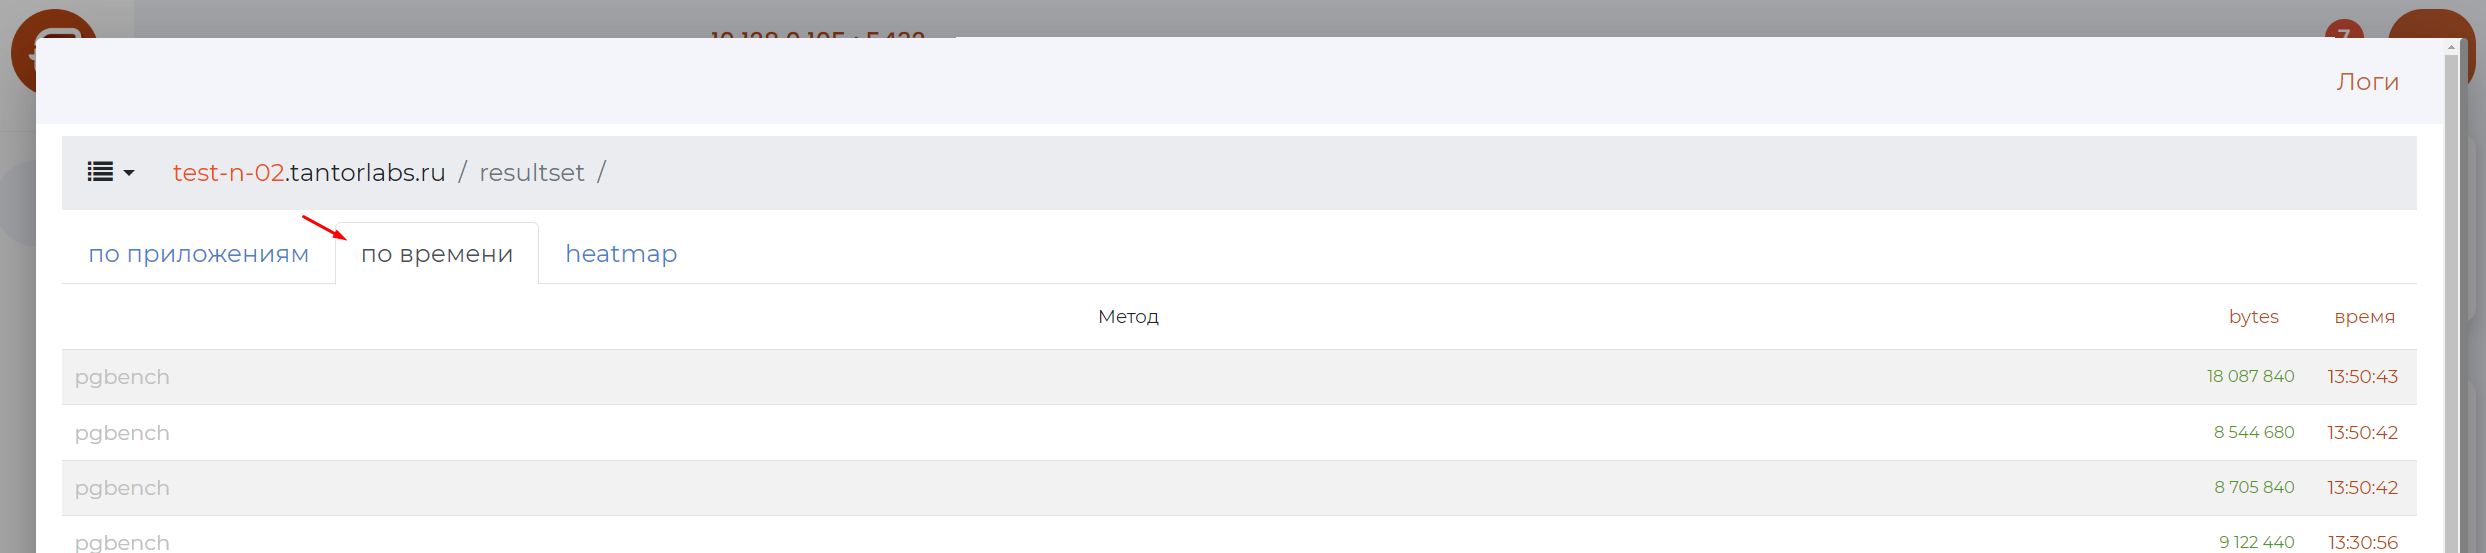
a list of all queries, sorted in chronological order or by size;
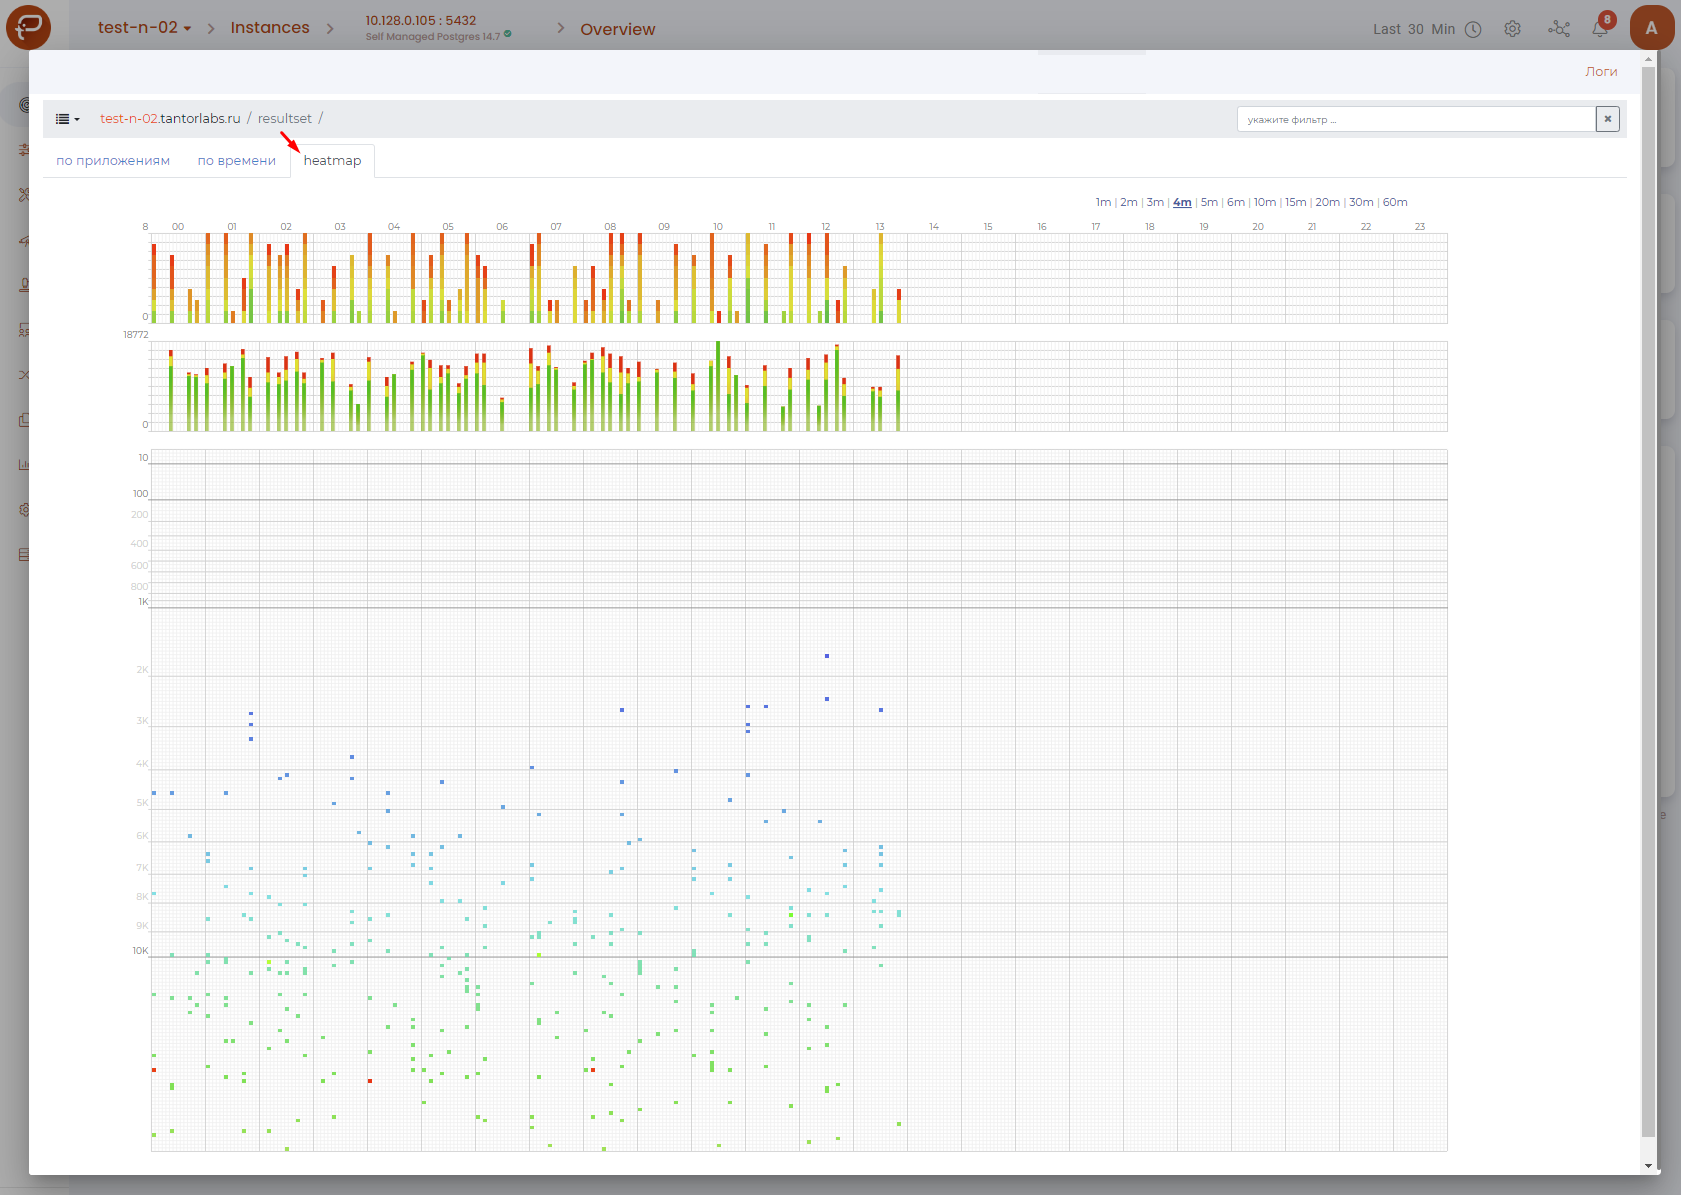
detailed heatmap with additional time interval settings.
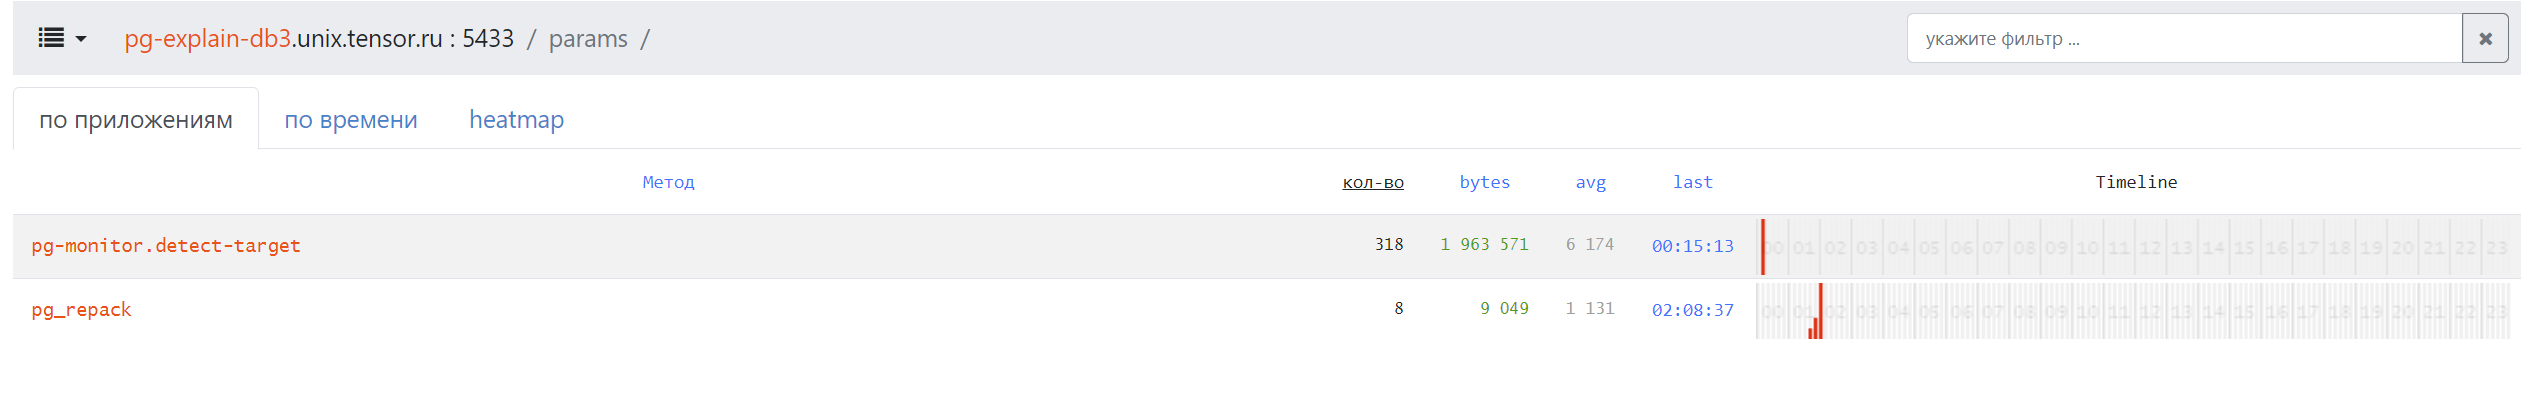
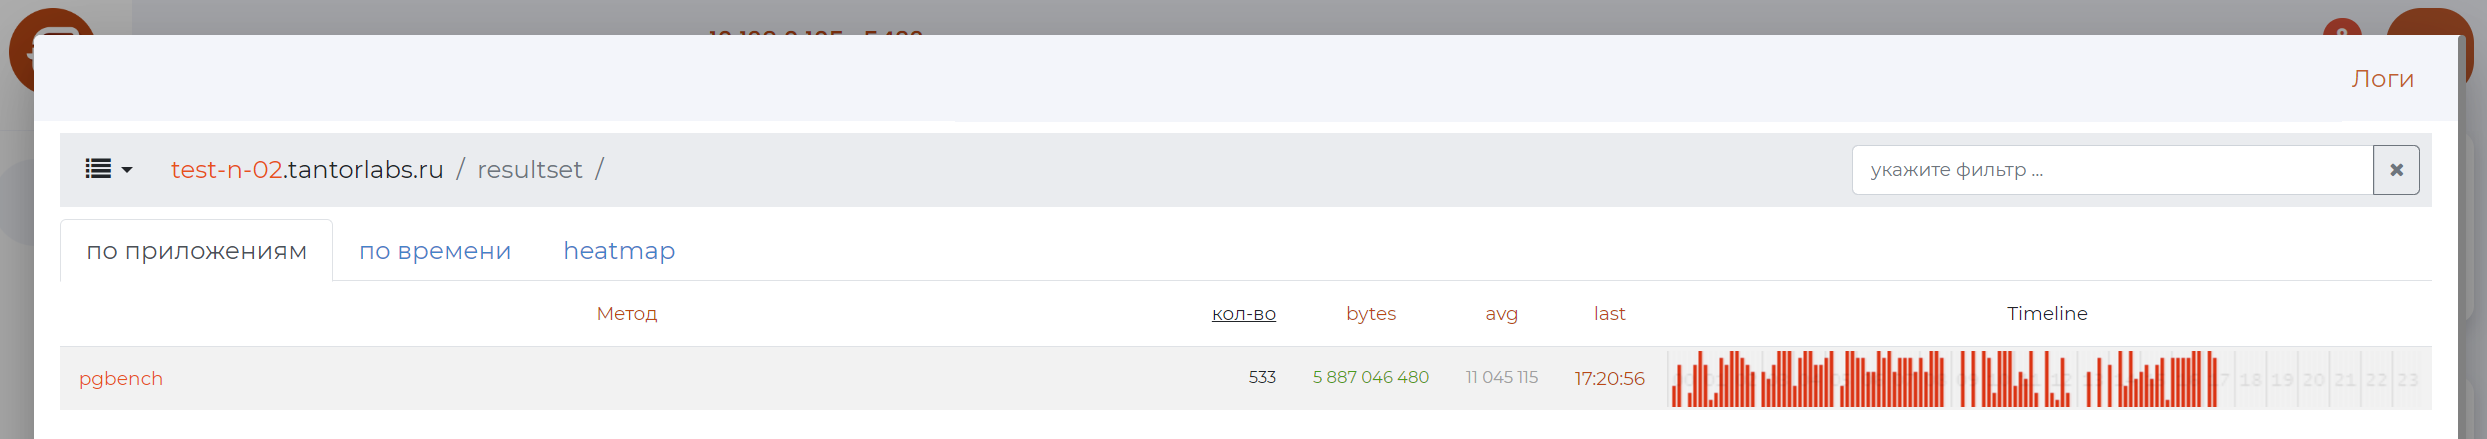
By Applications tab
Page content:
#. .. include:: pg_m_glossary/pg_m_156Метод.gls #. .. include:: pg_m_glossary/pg_m_153кол-во.gls
3. .. include:: pg_m_glossary/pg_m_052last.gls #. .. include:: pg_m_glossary/pg_m_114Timeline.gls
By Time tab
Heatmap tab